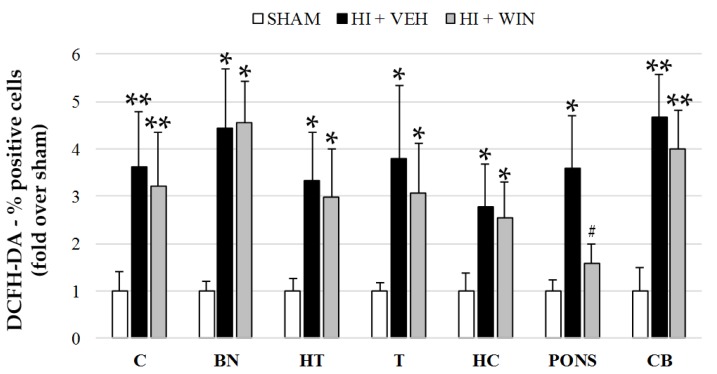
Figure 1.
Quantification of ROS in different brain regions evaluated after sham or HI (and vehicle or WIN treatment) in fetal lambs. Samples from both hemispheres were analyzed in triplicate by flow cytometry (n = 6) for each animal and condition. Values given as the mean ± SD. (*) ANOVA p < 0.05 vs. sham and HI+WIN; (**) ANOVA p < 0.01 vs. sham and HI+WIN; (#) ANOVA p < 0.05 vs. HI+VEH. Sham, n = 6; HI+VEH, n = 6; HI+WIN, n = 6. (C: cortex; BN: basal nuclei; HT: hypothalamus; T: thalamus; HC: hippocampus; CB: cerebellum).

