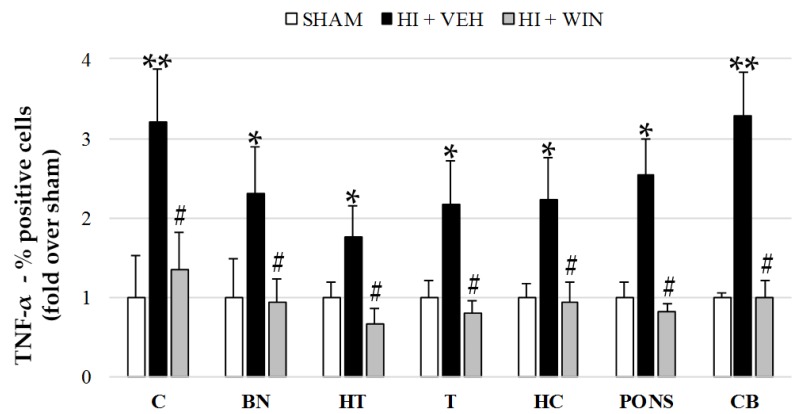
Figure 4.
Evaluation of TNF-α expression in different brain regions evaluated after sham or HI (and vehicle or WIN treatment) in fetal lambs. Samples from both hemispheres were analyzed in triplicate by flow cytometry (n = 6) for each animal and condition. Values given as the mean ± SD of the percentage of TNF-α positive cells. (*) ANOVA p < 0.05 vs. sham and HI+WIN; (**) ANOVA p < 0.01 vs. sham and HI+WIN; (#) ANOVA p < 0.05 vs. HI+VEH. Sham, n = 6; HI+VEH, n = 6; HI+WIN, n = 6. (C: cortex; BN: basal nuclei; HT: hypothalamus; T: thalamus; HC: hippocampus; CB: cerebellum).

