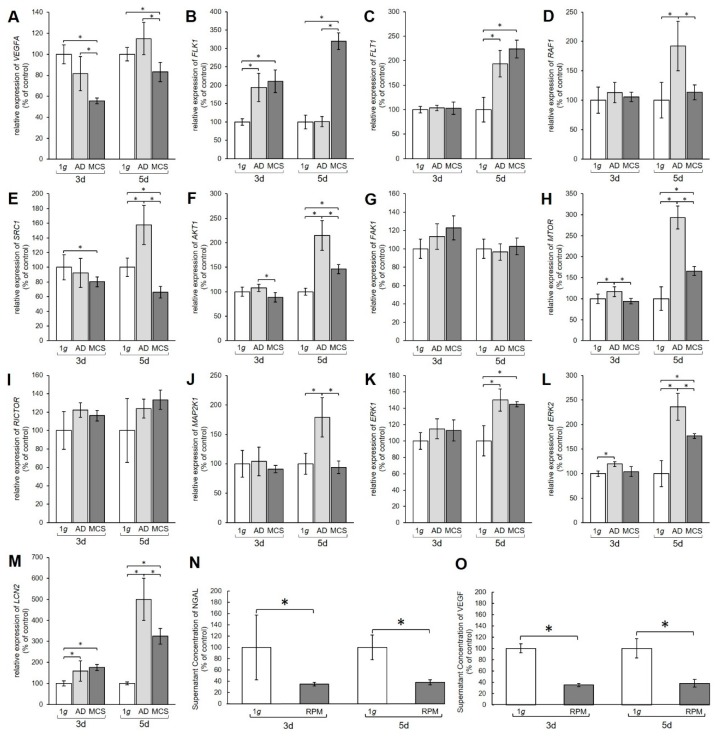
Figure 2.
Gene expression of various proteins from the vascular endothelial growth factor (VEGF) signaling pathway. Results show relative mRNA transcription levels from (A) VEGFA, (B) FLK1, (C) FLT1, (D) RAF1, (E) SRC1, (F) AKT1, (G) FAK1, (H) MTOR, (I) RICTOR, (J) MAP2K1, (K) ERK1, (L) ERK2, and (M) LCN2 genes. Results are shown as percentages of 3-day and 5-day 1 g controls. Time-resolved immunofluorometric assay (TRIFMA) results show amounts of (N) NGAL and (O) VEGF proteins in the supernatant taken from 3-day and 5-day flasks containing PC-3 cells, shown as percentages of 3-day and 5-day 1 g controls. * p < 0.05.

