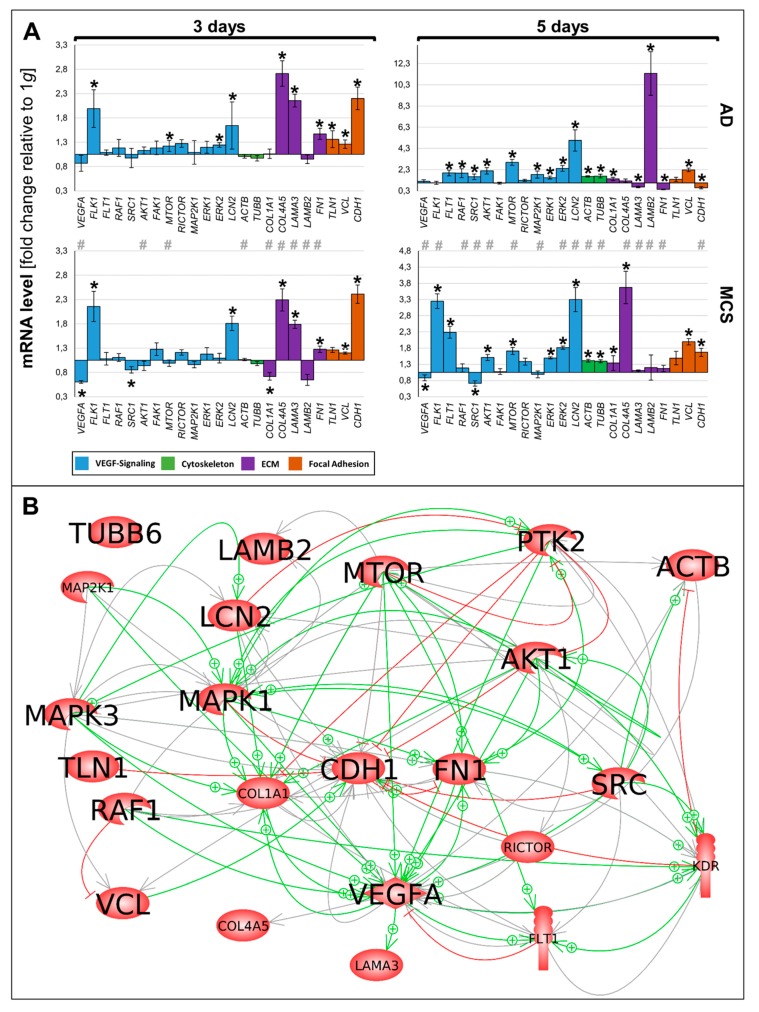
Figure 6.
(A) Summary of gene expression fold change measured by qPCR of 3- and 5-day RPM-exposed PC-3 samples. Results determined in AD and MCS in relation to 1 g are shown. Color-coded bars represent genes of related biological processes. * p < 0.01 1 g vs. AD/MCS, # p < 0.01 AD vs. MCS. (B) Interaction network of selected items at gene expression level; 22 of 23 selected genes analyzed by qPCR contribute to the network comprising 114 relations. Green arrows indicate activation and red arrows indicate inhibition. Gray lines signify that interactions take place whose effects have not been clarified. The interaction network was built using Elsevier Pathway Studio plus.

