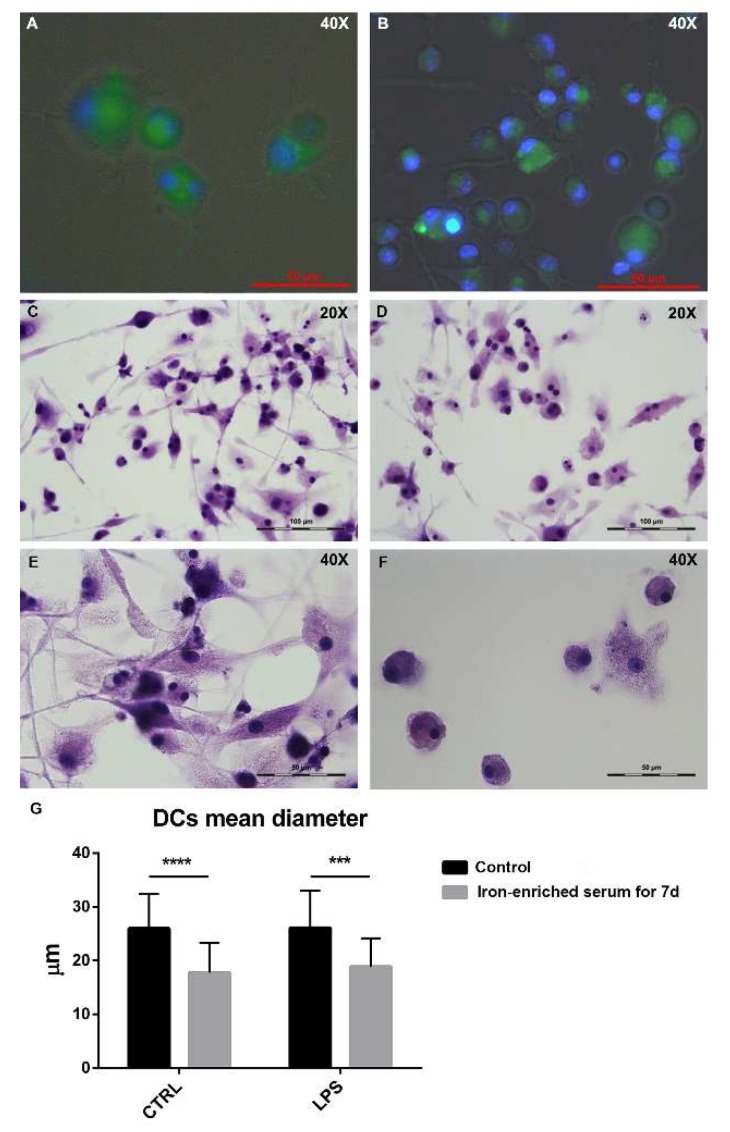
Figure 3.
Fluorescence staining of BMDCs administered with FITC-dextran (Fluorescein isothiocyanate-dextran), control cells stimulated with LPS for 24 h (A) and cells grown in iron-enriched medium for seven days stimulated with LPS for 24 h (B). Hematoxylin staining for control cells stimulated with LPS for 24 h (C,E) and cells grown in iron-enriched medium for seven days and stimulated with LPS for 24 h (D,F) shows their different size and morphology. Bar plot shows a significant difference in DCs size (G). Images were taken with a 20× objective and a 40× immersion objective. *** p < 0.001 **** p < 0.0001.

