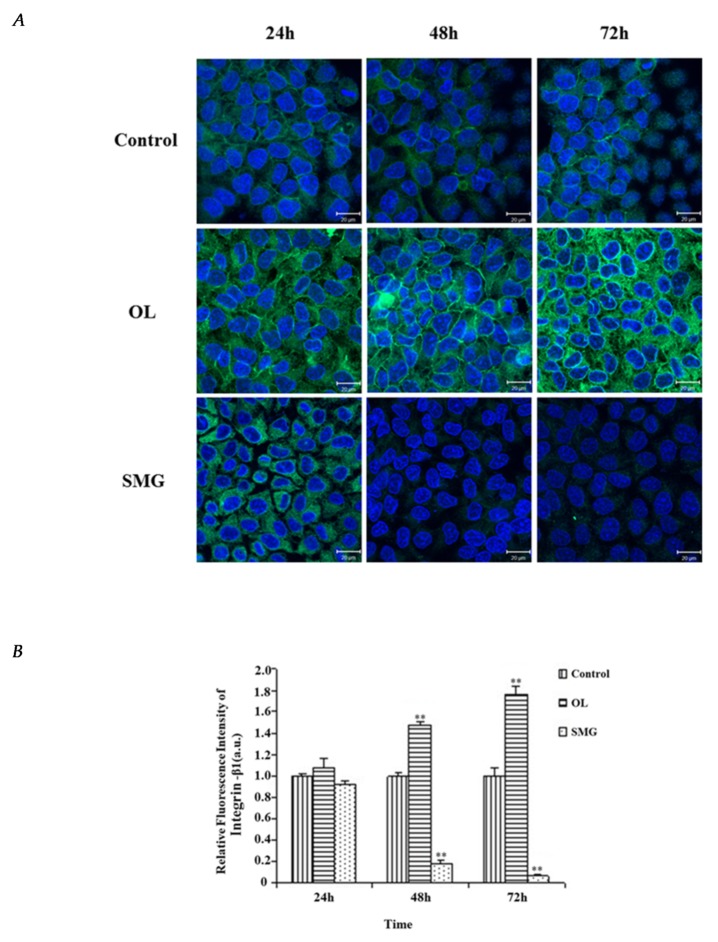
Figure 3.
The expression of integrin β1 in HUVEC cells after mechanical treatment. (A) The results of immunofluorescence experiments. The blue color indicates the nucleus, and the green color represents the integrin β1 protein. a. 24 h Control; b. 48 h Control; c. 72 h Control; d. 24 h Overload; e. 48 h Overload; f. 72 h Overload; g. 24 h SMG; h. 48 h SMG; i. 72 h SMG. (B) Relative fluorescence intensity of integrin β1 in HUVEC cells. significant difference; ** p < 0.01, extremely significant.

