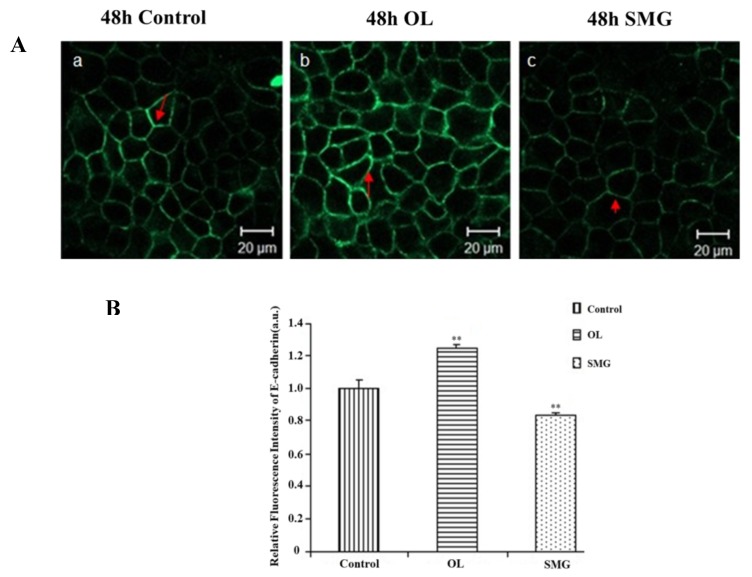
Figure 7.
The expression of E-cadherin in MCF-7 cells after mechanical treatment. (A) The results of immunofluorescence experiments. The blue color indicates the nucleus, and the green color represents the paxillin protein. a. 48 h Control; b. 48 h Overload; c. 48 h SMG. (B) Relative fluorescence intensity of E-cadherin in MCF-7 cells after mechanical changes. Significant difference; ** p < 0.01, extremely significant.

