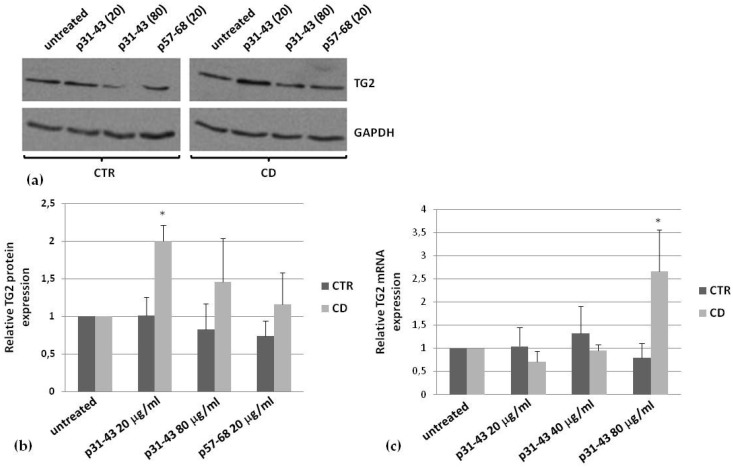
Figure 6.
Effect of p31–43 on TG2 expression. (a) Representative western blot of TG2 expression induced by a treatment for 48 h in the presence of p31–43 (20 and 80 μg/mL) and p57–68 (80 μg/mL). (b) Densitometric analysis of blots relative to three control and three CD samples. In all experiments, 35 μg of total proteins were loaded for analysis. GAPDH was used as the internal reference. (c) Real-time PCR analysis to quantify relative amounts of TG2 in the presence of 20, 40, and 80 μg/mL of p31–43, in three control and three CD samples. Asterisks (*) indicate that p < 0.05 vs. respective untreated samples.

