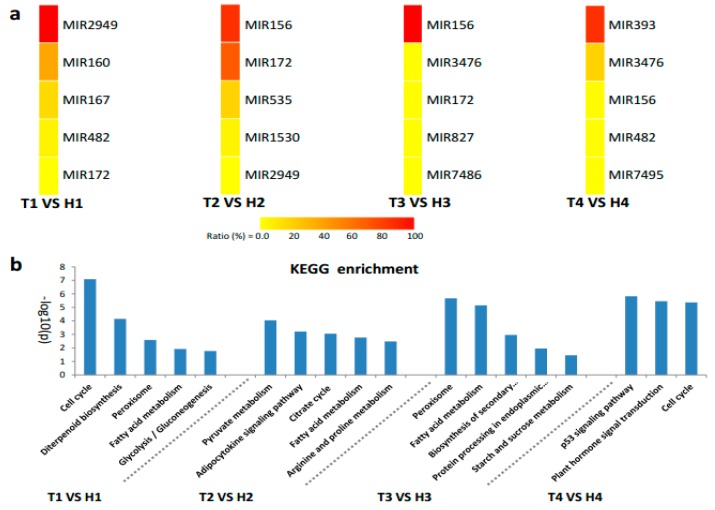
Figure 4.
Heatmap of the expression abundance of differentially expressed miRNA families and Kyoto Encyclopedia of Genes and Genomes (KEGG) enrichment analysis of the predicted target genes. (a) The top five expression abundance rates of miRNA families responding to HT stress in the HT-tolerant and the HT-sensitive lines. The expression abundance rate is determined as the expression abundance (in percentage) of a miRNA family over the total expression abundance of miRNA families at a certain stage (sum of family member’s expression abundance/the sum of expression abundance of all differentially expressed miRNAs at a certain stage). (b) KEGG enrichment of target genes of miRNA families with high expression abundance.

