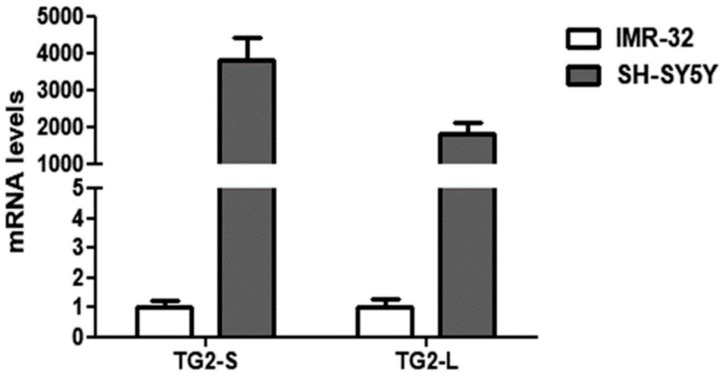
Figure 2.
Comparison of basal transcript levels of the two TG2 isoforms, TG2-L and TG2-S, between SH-SY5Y and IMR-32 NB cells cultured in normal O2 conditions. The relative mRNA levels of TG2-L and TG2-S in SH-SY5Y are expressed as fold changes in comparison to IMR-32 cells. Data are expressed as mean ± SEM.

