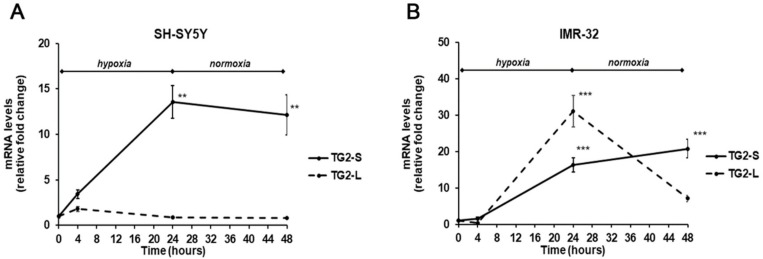
Figure 3.
Differential expression of TG2-L and TG2-S transcripts in SH-SY5Y (A) and IMR-32 (B) NB cells after exposure to hypoxic conditions (1% O2) up to 24 h followed by reoxygenation for further 24 h. After incubation times, cells were harvested and the mRNA levels were evaluated by Real-Time PCR. Data are expressed as mean ± SEM. **p < 0.01 and ***p < 0.001 significant differences in comparison to controls.

