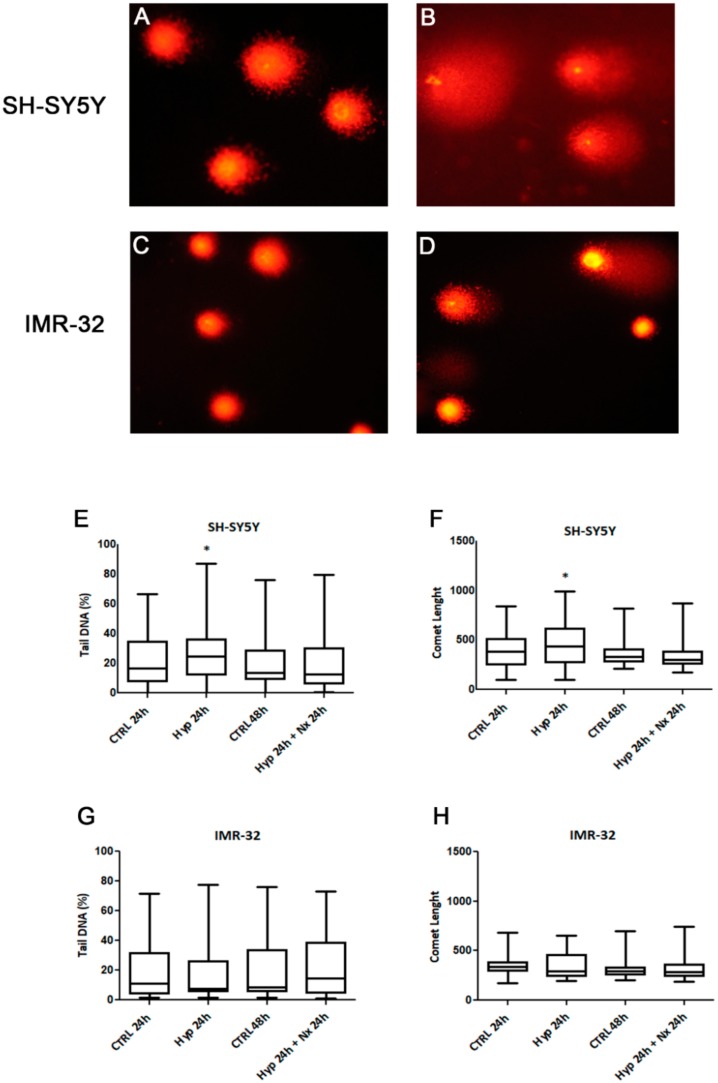
Figure 5.
Comet assay pictures of DNA fragmentation in SH-SY5Y (A,B) and IMR-32 (C,D) NB cells exposed to normal O2 (A,C) and hypoxic (B,D) conditions for 24 h., and graphs of Comet parameters calculated in cell cultures exposed or not to hypoxia for 24 h followed by reoxygenation for further 24 h (E–H). Values are expressed as median, 25th and 75th percentiles and minimum and maximum. *p < 0.05 significant difference in comparison to control cells.

