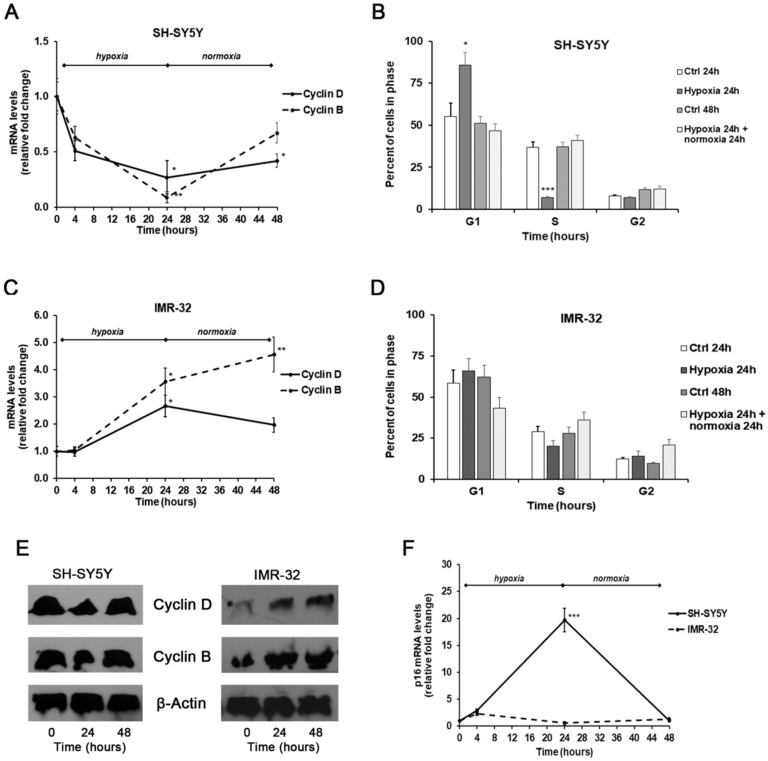
Figure 6.
Effects of the exposure to hypoxia on cell–cycle progression. mRNA levels of cyclin D1, B1, and p16 in SH-SY5Y and IMR-32 NB cells were evaluated by Real Time-PCR (A,C,F). Protein levels of cyclin B1 and D1 were evaluated by Western Blotting (E). Cell-cycle progression in SH-SY5Y (B) and IMR-32 (D) NB cells was measured by FACS analysis. Histogram represents the percentages of cells in G1, S, and G2/M-phases. Data are expressed as mean ± SEM. *p < 0.05, **p < 0.01 and ***p < 0.01 significant differences in comparison to controls.

