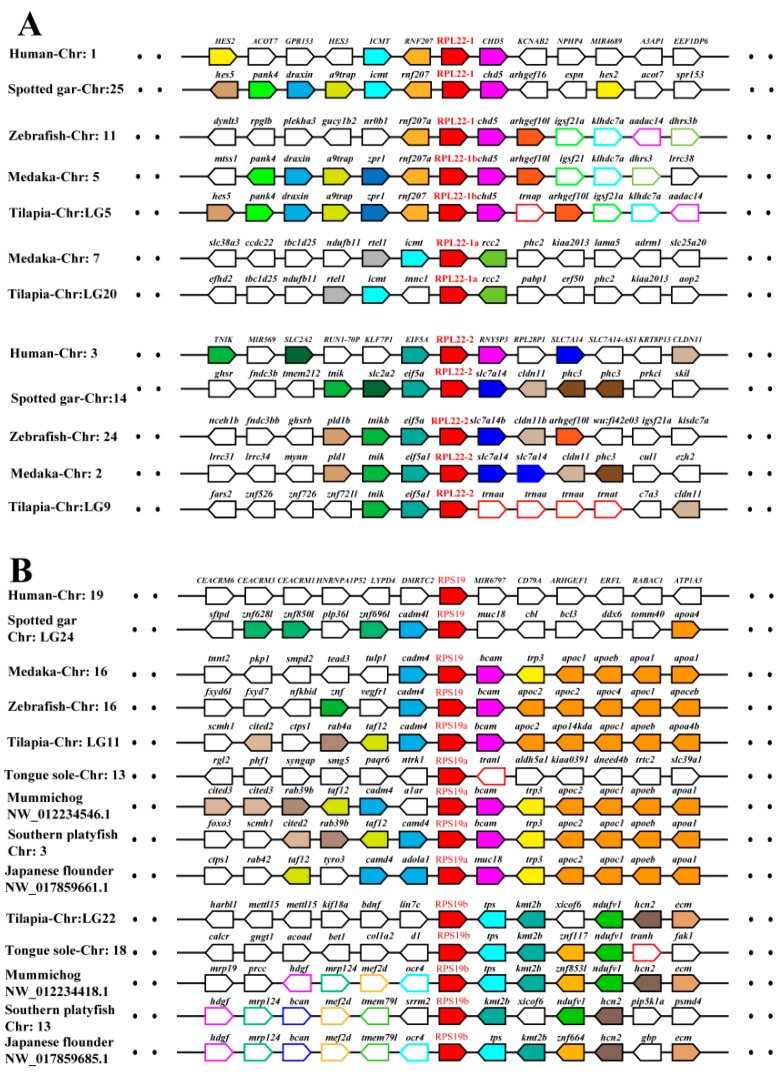
Figure 4.
Synteny analyses of RPL22 (A) and RPS19 (B) and their adjacent genes in tilapia and other vertebrates. Rectangles represent genes in chromosome/scaffold. Dotted lines represent omitted genes of the chromosome/scaffold. The direction of the arrows indicates the gene orientation. The RP genes are shown in red, while the other genes are shown in different color.

