Figure 2.
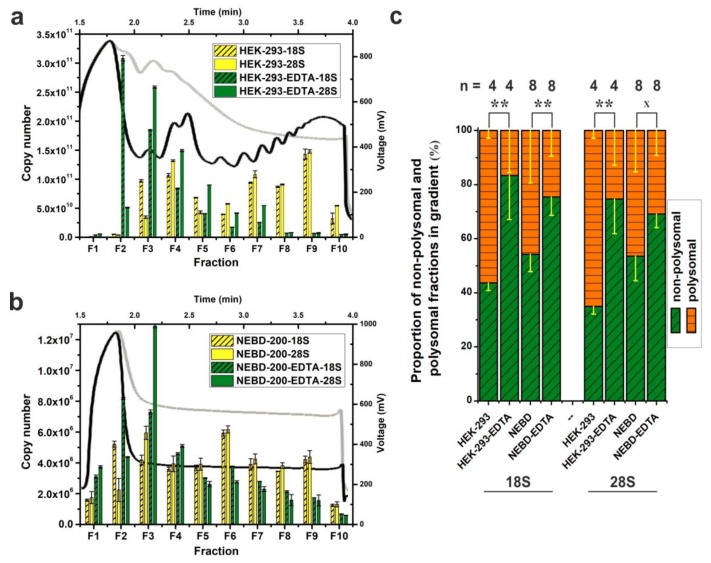
qRT-PCR-based visualization of polysome profiles from scarce samples using SW55Ti tubes. Comparison of polysome profiles of HEK-293 cells (a) and 200 NEBD-stage oocytes (b). Black curves and yellow columns in each chart indicate untreated lysates; EDTA-treated polysome profiles are traced in light grey and green columns. Absolute copy number of 18S and 28S rRNA was determined in fractions F1–F10 and error bars display ±SD of qPCR technical triplicates. (c) Proportion of the non-polysomal (NP, fractions F2–F5, in green) and polysomal (P, fractions F6–F10, in orange) parts of profiles from untreated and EDTA-treated HEK-293 cells and NEBD-stage oocytes; error bars, ±SD; n, number of independent biological replicates; ** p < 0.001; x signifies a lack of significance; only non-treated and EDTA-treated pairs from Dunn’s multiple comparison are displayed.

