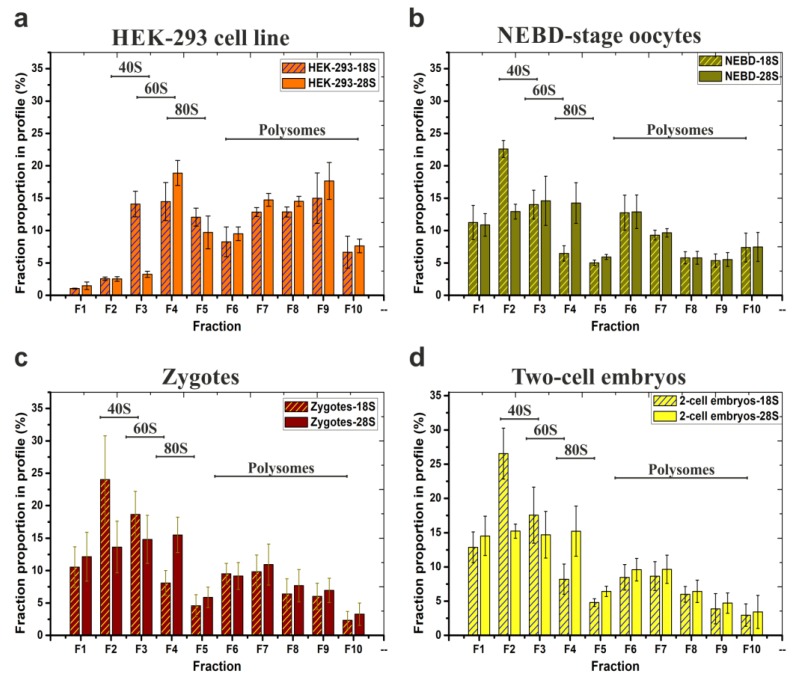
Figure 3.
Typical distribution and abundance of ribosome- and polysome- ribonucleoprotein complexes in polysome profiles as determined by qRT-PCR analysis. Data are derived from four biological replicates of: (a) HEK-293 cell line (note, the same samples were analysed in Figure 2c); (b) 200 mouse NEBD-stage oocytes used for RNA-seq; (c) 200 zygotes and (d) 200 two-cell embryos. 18S and 28S contents in each fraction are displayed as percentages of the respective fraction compared to the whole polysome profile; error bars indicate ±SD of biological replicates. Note, qRT-PCR-based visualization of individual replicate/source polysome profiles are included in Figure S4.

