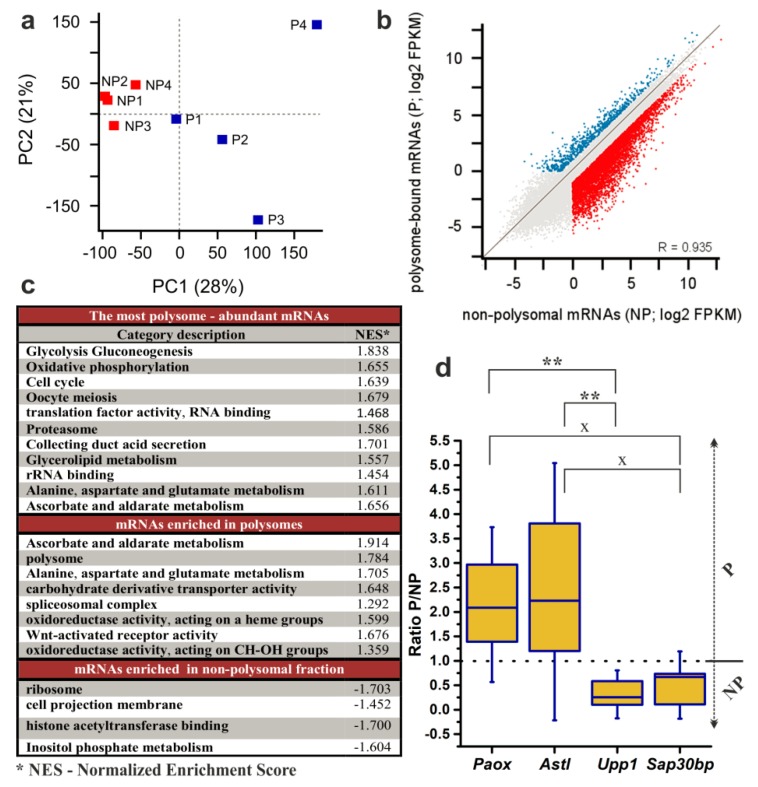
Figure 4.
Analysis of RNA-seq results of 200 NEBD-stage oocytes. Non-polysomal (NP) and polysomal (P) RNAs were sequenced in four biological replicates. (a) Principal Component Analysis was applied to demonstrate variability among biological replicates. (b) Scatter plot highlighting genes with FPKM > 1 (fragments per kilobase per million reads mapped > 1) and > 2-fold enrichment in the NP (blue) and in the P (red). (c) Enriched gene categories according to GO (Gene Ontology) and KEGG (Kyoto Encyclopedia of Genes and Genomes) terms in dataset of all expressed genes with cut-off score of FPKM > 1. (d) qRT-PCR determination of the P/NP ratio for selected transcripts in three additional biological replicates. Box plot displays mean, 25th and 75th percentile and ±SD; dotted line indicates no fold change; ** p < 0.01; x signifies a lack of significance; Dunn´s multiple comparison is displayed only for pairs of transcripts that have been originally selected to be preferentially enriched in either the P or the NP dataset according to DeSeq2.

