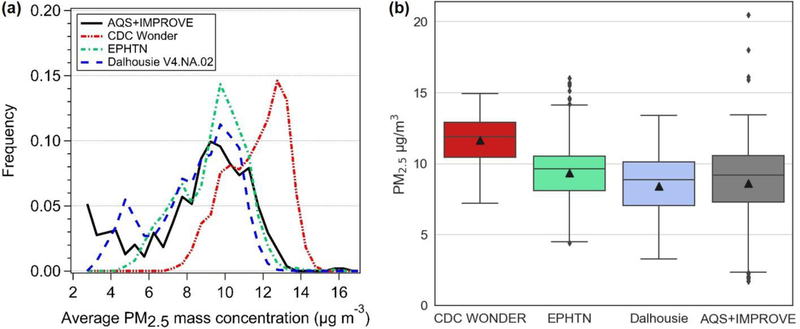
Figure 3.
(a) Frequency distributions of the county-average 2011 annual mean PM2.5 mass concentrations for the four data sets shown in Figure 1. (b) Mean (triangles), median (horizontal bar in the middle), 25 and 75 percentiles (bottom and top of the box, respectively) for the four data sets. Black dots represent outliers.

