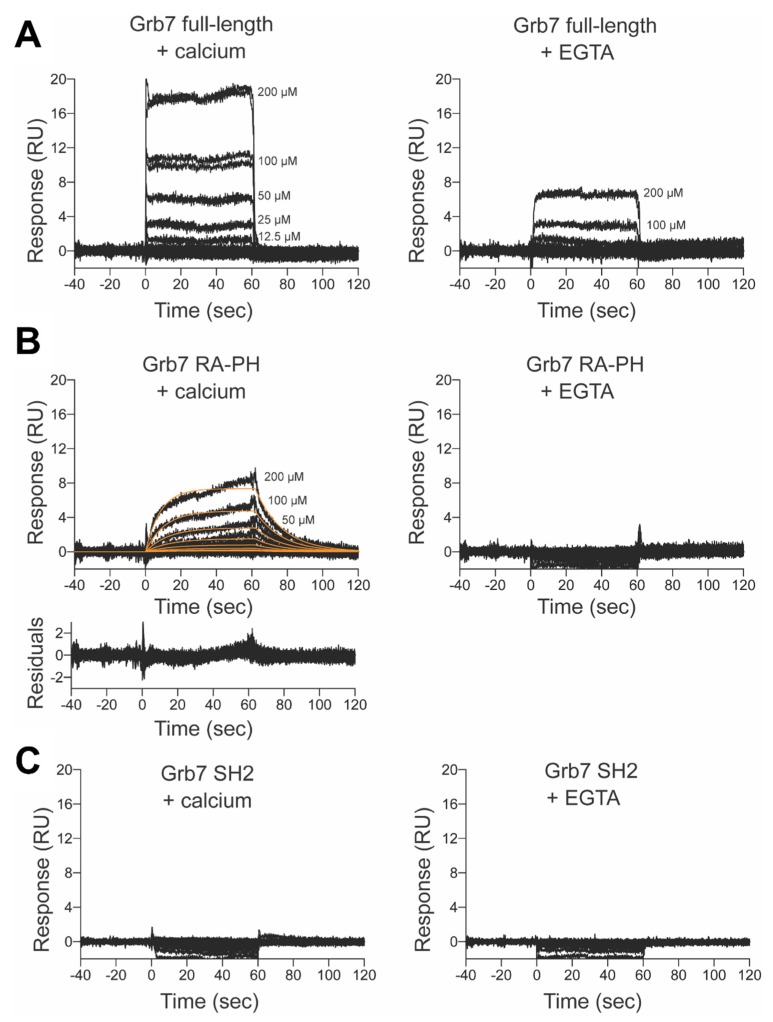
Figure 4.
Investigating the interaction between Grb7 and CaM. Sensorgrams of CaM binding to various Grb7 domains in buffer containing 5 mM CaCl2 (left hand panel) or 5 mM EGTA (right hand panel). Duplicate sensorgrams are shown for each CaM concentration, as indicated. (A) Binding to full-length Grb7; (B) Binding to Grb7 RA-PH domain, with the fit to a 1:1 binding model shown in orange. The residuals of the fit are displayed in the bottom graph; (C) Binding to the Grb7-SH2.

