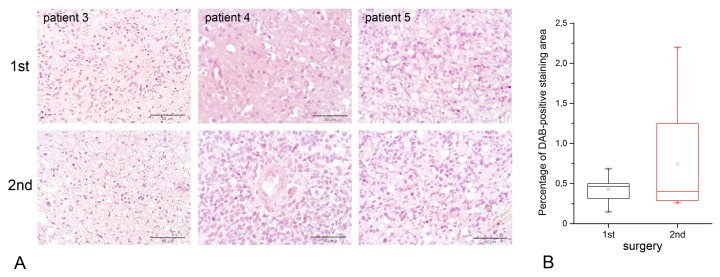
Figure 2.
HPSE expression in primary glioblastoma (first surgery) and relapsed one (second surgery). (A) Immunohistochemical analysis of HPSE expression in primary and relapsed glioblastoma. Representative pictures are shown. Magnification: 400×. Scale bars: 50 μm. (B) Quantitative analysis of anti-HPSE staining intensities in primary and relapsed glioblastoma. Bars represent the mean for all the clinical samples for each tissue type from triplicate experiments ± SD (Origin 8.5; OriginLab Corporation, Northampton, USA).

