Figure 1.
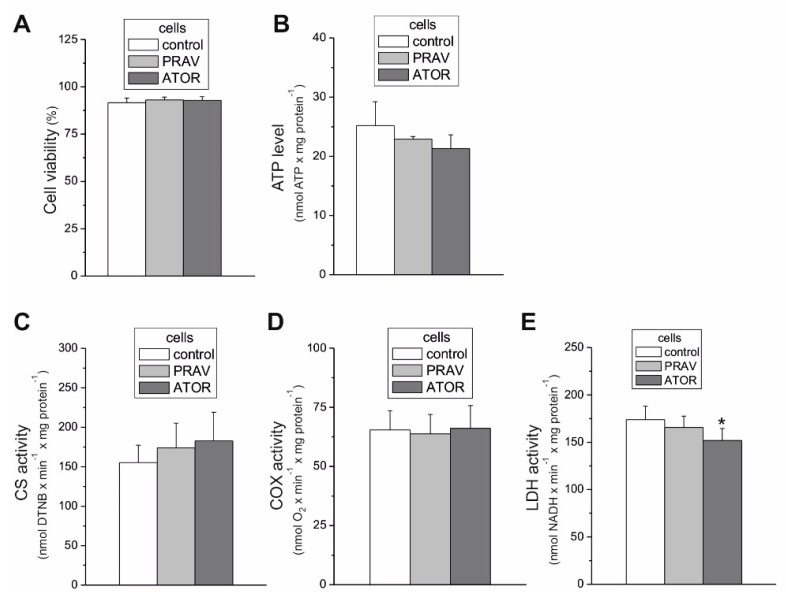
Cell viability (A), ATP level (B), maximal activities of marker enzymes of aerobic (C,D), and anaerobic catabolism (E) of endothelial EA.hy926, 100 nM atorvastatin (ATOR)-treated and 100 nM pravastatin (PRAV)-treated cells. Mean ± standard deviation (SD); n = 5; p < 0.05 (*), comparison vs. control values.

