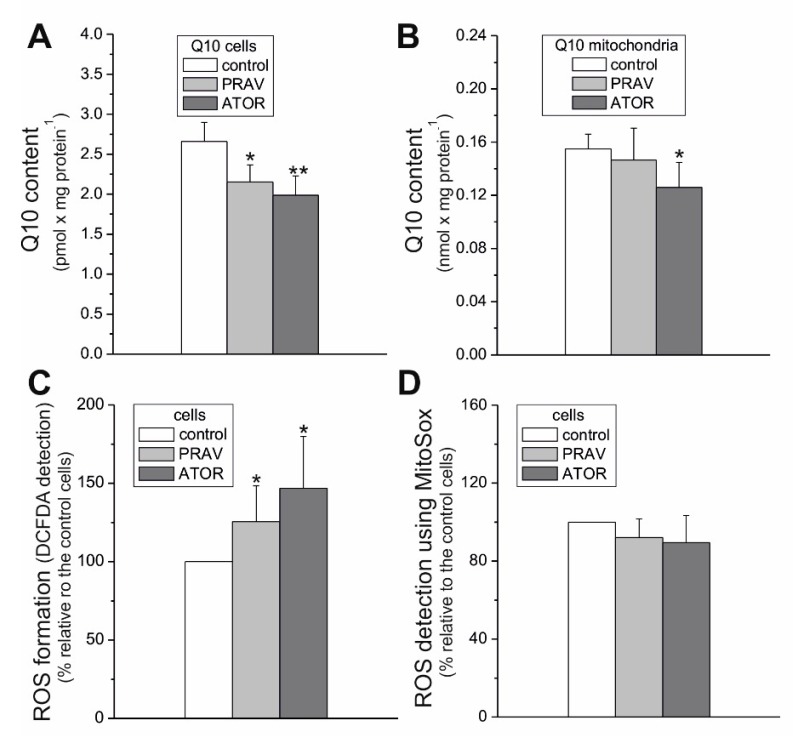
Figure 4.
Cellular and mitochondrial Q10 content and ROS formation in endothelial cells grown for 6 days in the presence of 100 nM PRAV or 100 nM ATOR or under control conditions. Q10 concentration in endothelial cells (A) and mitochondria (B). Measurements of total cellular ROS using CM-H2DCFDA (C) and ROS formation with the MitoSox probe (D). Mean ± SD; n = 6-9. p < 0.05 (*), p < 0.01 (**), comparison vs. control values.

