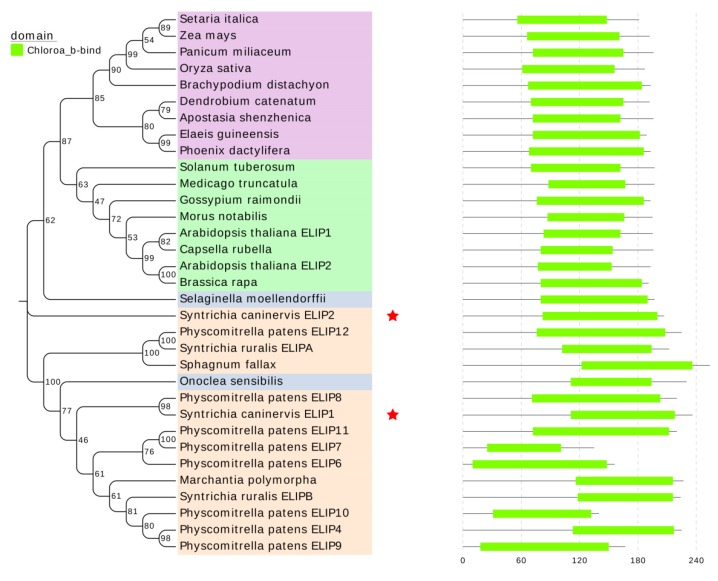
Figure 1.
The phylogenetic tree inferred from the deduced protein sequence of ScELIPs and other 34 ELIP amid acid sequences represented by 24 additional taxa and conserved domain. In the left pannel, numbers above the lines represent bootstrap percentages (based on 1000 replicates). A bootstrap value of 100% indicates branches that were supported in all replicates of resampling of data. The scale bar indicates the number changes per unit length. The two ScELIPs were highlighted by a red star. Different colors represent different evolving groups, pink (bryophytes), blue (ferns), purple (monocots), and green (eudicots). In the right pannel, the conserved domain of ELIPs corresponding to the left pannel.

