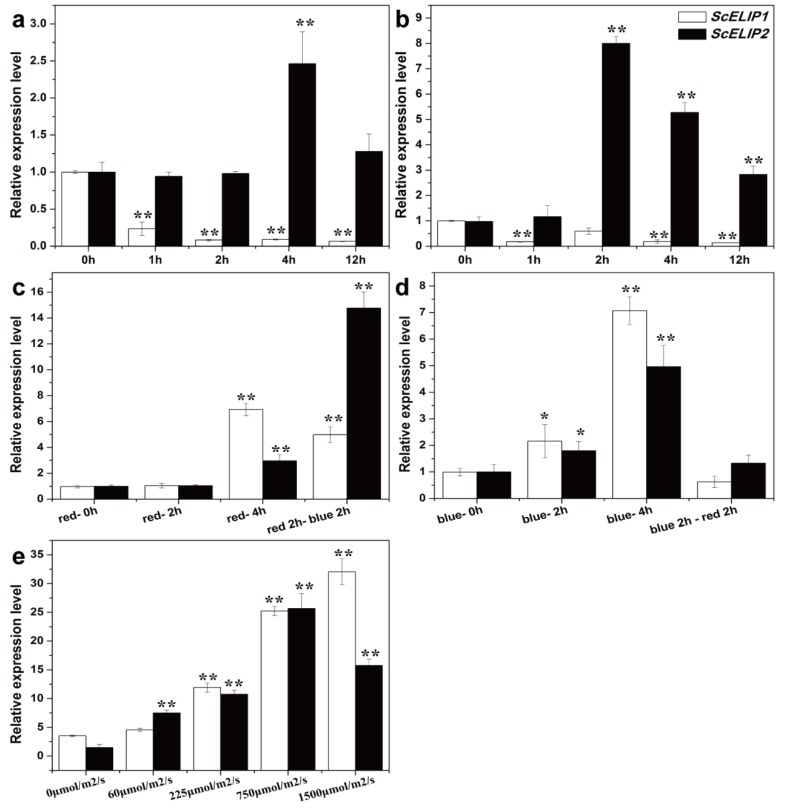
Figure 2.
ScELIP1 and ScELIP2 transcript relative abundance assessments in Syntrichia caninervis gametophores exposed to various light treatments. The mean (each column) and SD (error bar) were calculated with three biological replicates and three technical replicates of each biological replicates. * p < 0.05; ** p < 0.01. P-values were obtained from Dunnett’s T3 test comparing different time points and treatment with control. Asterisk represents statistically significant difference with 0 h in (a–d), and 0 μmoL/m2/s in (e). ultra violet A (UVA) light treatment (a), ultra violet B (UVB) light treatment (b), red-light treatment (c), blue-light treatment (d), high-light treatment (e).

