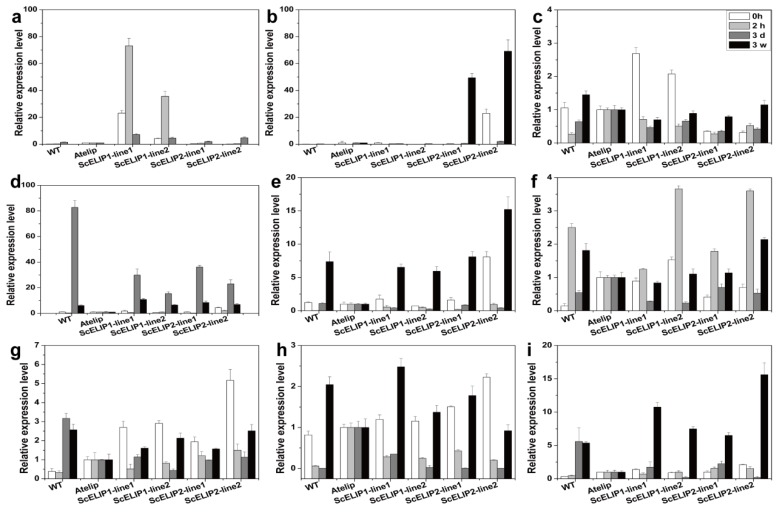
Figure 8.
Twelve photosynthesis genes transcript relative abundance assessments in Arabidopsis thaliana different genotypes (WT, Atelip, transgenic lines) exposed to high-light treatments (1000 μmol/m2/s) for various times. Error bars represent the SD of three biological repeats. Relative expression values were obtained from 2−ΔΔCt comparing WT and the transgenic lines with the Atelip mutant, respectively. ScELIP1: The inserted S. caninervis ELIP1 coding sequence (a), ScELIP2: The inserted S. caninervis ELIP2 coding sequence (b), PSBS: The native Arabidopsis PSII CP22 protein gene (PSBS) transcript (c), OHP: The native Arabidopsis one-helix protein gene (OHP) transcript (d), OHP2: The native Arabidopsis one-helix protein 2 gene (OHP2) transcript (e), SEP2: The native Arabidopsis two-helix protein gene (SEP) transcript (f), LHCA2: The native Arabidopsis PSI antenna protein gene (LHCA2) transcript (g), LHCB4.2: The native Arabidopsis PSII CP29 antenna protein gene (LHCB4.2) transcript (h), PSBD: The native Arabidopsis PSII D2 protein gene (PSBD) transcript (i).

