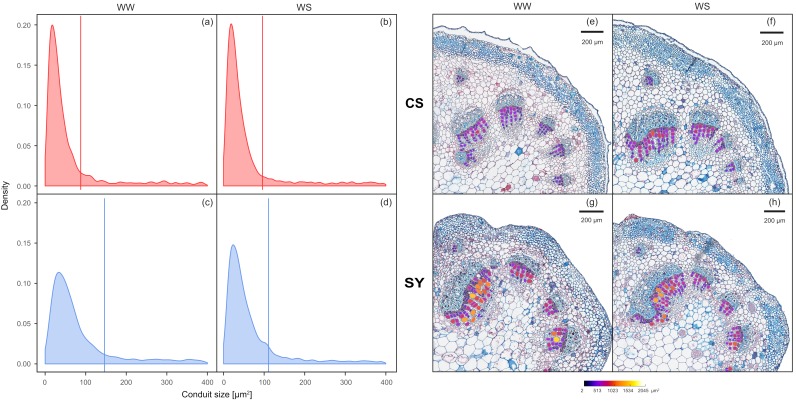
Figure 2.
Left panel: frequency of xylem conduit size in petioles of Cabernet Sauvignon (CS) (a,b) and Syrah (SY) (c,d) vines under well-watered (WW) and water stress (WS) conditions. Lines correspond to the mean values of each distribution curve. Right panel: representative cross-sections of Cabernet Sauvignon (CS) (e,f) and Syrah (SY) (g,h) petioles, in well-watered (WW) and water stress (WS) conditions. The color scale indicates different conduit sizes (from dark blue for the narrower to white for the wider).

