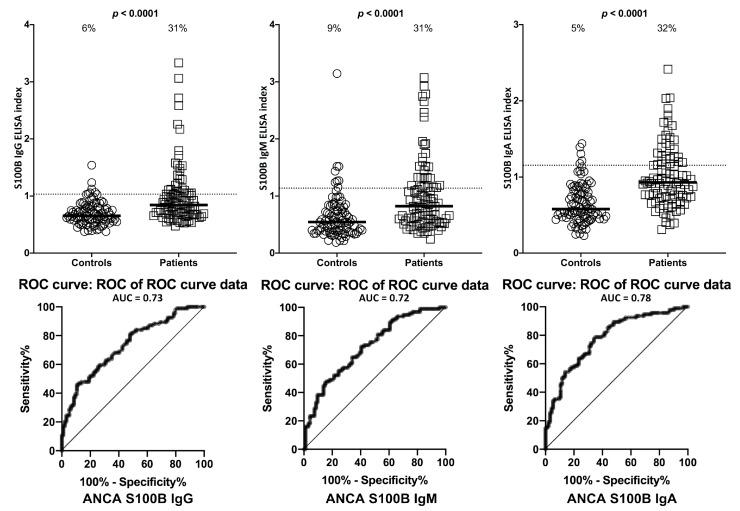
Figure 8.
Percentage of elevation of IgG, IgM, and IgA antibodies against S100B in 94 patients positive for ANCA and in 94 healthy controls. Dotted lines indicate the cutoff for positivity used in each assay, as calculated by ROC analysis. The percentage of elevation is indicated on top of each distribution, while bars indicate the corresponding median. The AUC for S100B IgG was 0.73, 0.72 for S100B IgM, and 0.78 for S100B IgA.

