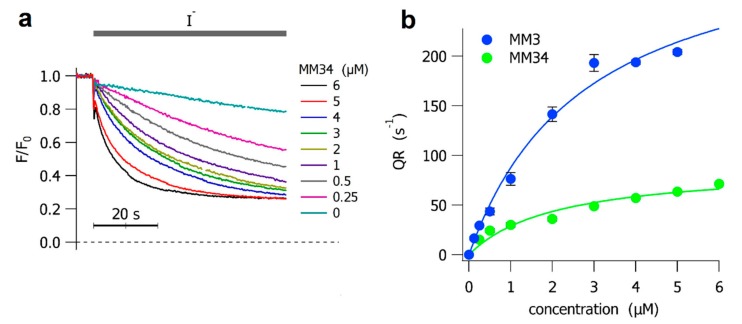
Figure 2.
Anionophore-driven halide transport in Fischer Rat Thyroid (FRT) cells. (a) The time course of the fluorescence decay in FRT cells incubated at different concentrations of MM34, as indicated. The addition of iodide is indicated by the gray line over the traces. Cells treated with DMSO were used as control. The time-calibration bar is shown below the traces. (b) The initial YFP-quenching rate (QR) obtained from FRT cells treated with different concentrations of MM3 (blue) and MM34 (green). Each point represents the means ± SEM from 8 experiments. The concentration–response curves, fitted with a Langmuir model, are represented as continuous lines.

