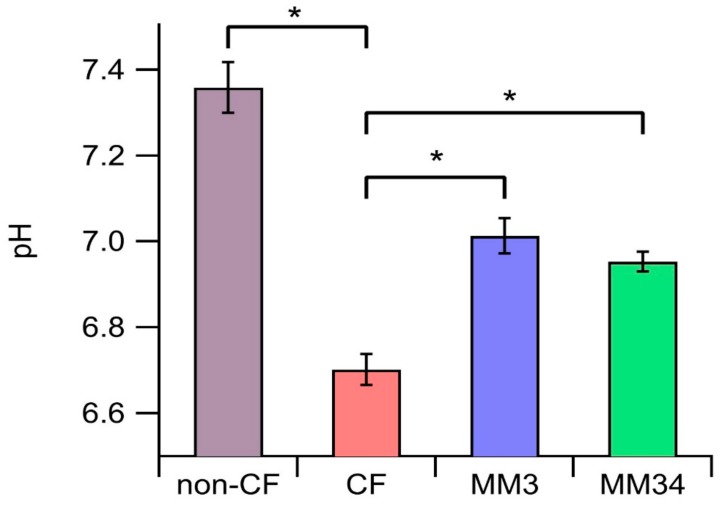
Figure 5.
Evaluation of the apical fluid pH. Bars indicate the average pH after 24 h of incubation. Untreated CF (n = 17) and non-CF (n = 8) epithelia were incubated with 0.1% DMSO as control. CF epithelia were incubated with 0.25 µM of MM3 (n = 9) or 0.25 µM of MM34 (n = 9). Data were obtained from two non-CF donors and two different homozygous F508del-CFTR patients. The asterisk (*) indicates a significant difference (p < 0.05) obtained from a Student’s non-paired-t test.

