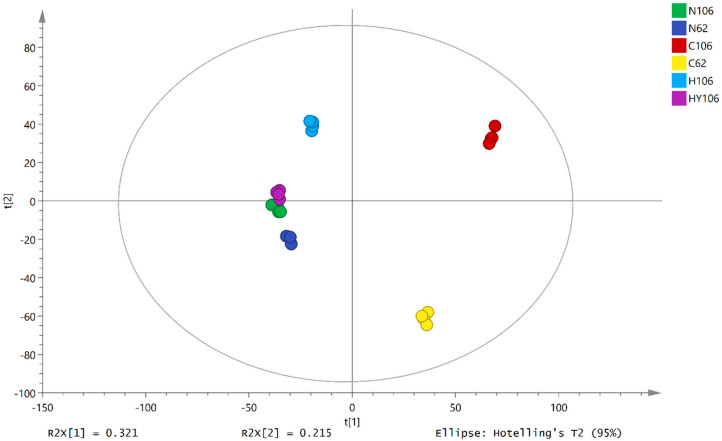
Figure 2.
PCA score plots for different lettuce seed metabolomes. A five principle component-based PCA model (R2X (cum) = 0.774, Q2(cum) = 0.49) for GC/MS and UPLC-IMS-QTOF/MS data was obtained; the PCA analysis separated six different groups (N62: S13K0062 dry seeds; N106: S15K106 dry seeds; C106: buds of S15k0106 seeds germinated at 21 °C; C62: buds of S13k0062 seeds germinated at 21 °C; H106: S15K106 seeds fail to germination at 35 °C; HY106: buds of S15k0106 seeds germinated at 35 °C) and revealed differences in the relative content of metabolites present in different groups.

