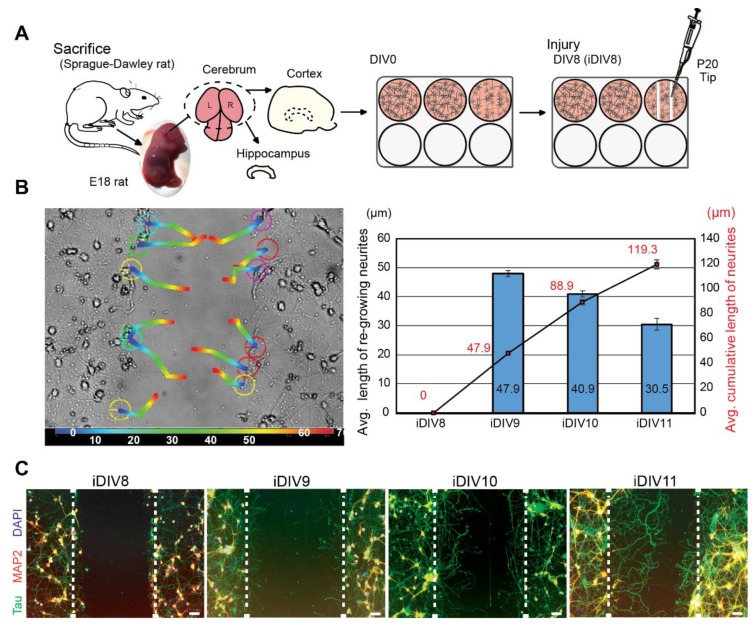
Figure 1.
Neurite re-growth of primary cortical neurons in an in vitro traumatic brain injury (TBI) model. (A) Schematic flow chart of experimental design. (B) Trajectory of single neurite re-growth was tracked from 0 h (blue) to 72 h (red) after injury using tracking function of AxioVision software (left). Quantitative results of average length of re-growing neurite (blue bars) and average cumulative length (line graph) are shown from iDIV8 to iDIV11 (right). (n = 3, track 12 neurites/experiment.) (C) Cortical neurons were fixed on iDIV8 to iDIV11 and were subjected to immunofluorescence staining with anti-Tau (green, axonal marker), anti-MAP2 (red, dendritic marker) antibodies, and DAPI (blue, nuclei). Merged images are shown. White dashed lines indicate the borders of the injured gap. Scale bar, 50 µm.

