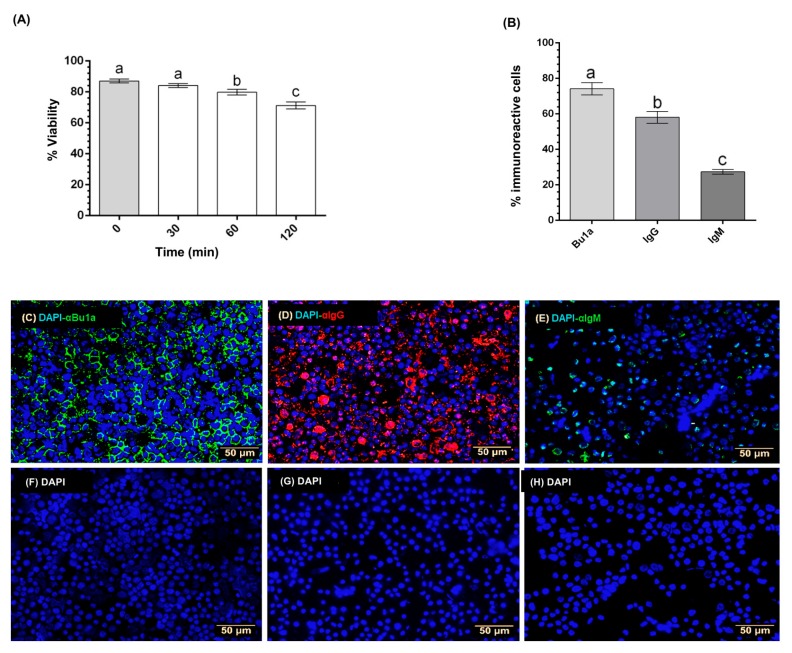
Figure 1.
Characterization of bursal B-lymphocyte (BBL) cultures. Cell viability of BBLs was determined by the trypan blue exclusion method over 120 min. (A). Each bar represents mean ± SEM, n = 3. Groups with different letters are significantly different (p < 0.0001) by using one-way ANOVA and Dunnett´s post-hoc test. Cell subpopulations were characterized by ICC using primary antibodies to detect whole B cells (α-Bu1a) (C), mature B cells (α-IgG) (D), and immature B-cells (α-IgM) (E). DAPI staining was used to detect cell nuclei. Negative controls were prepared in the absence of primary antibodies (F–H). The proportion of BBLs subpopulations was calculated dividing the number of immunoreactive cells to each antibody between total number of DAPI reactive cells (B). Each bar represents mean ± SEM, n = 3. Groups with different letters are significantly different (p < 0.001) by using one-way ANOVA and Dunnett´s post-hoc test.

