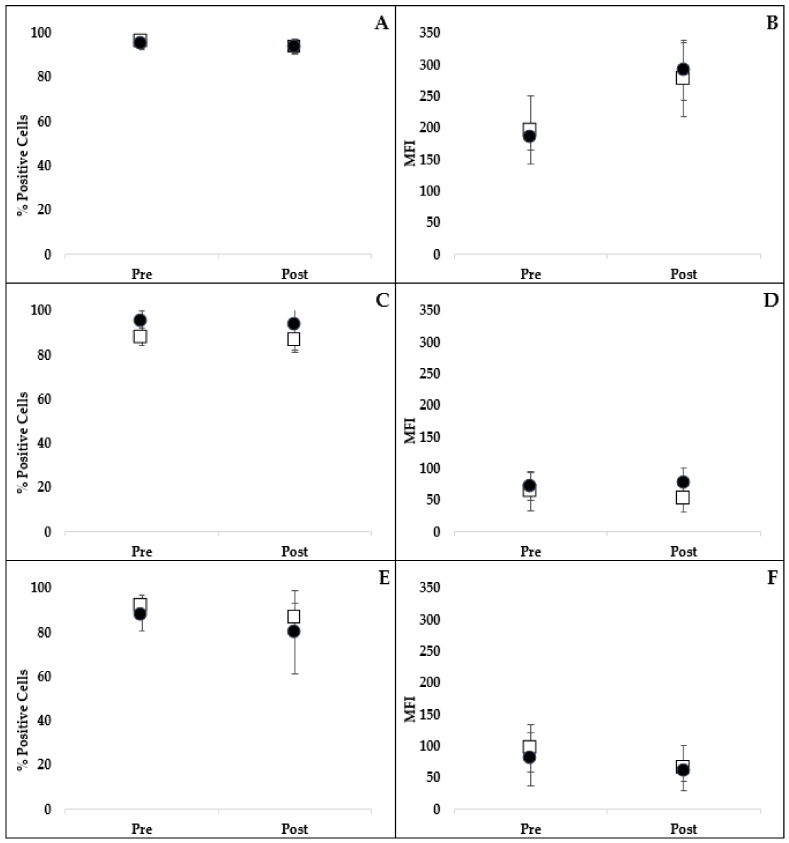
Figure 3.
Comparison of the percentage of neutrophils and monocytes phagocytizing FITC-labeled E. coli (A) and the MFI (B) representing the intensity of phagocytosis following stimulation with E. coli pre- and post- 3-week oral administration of placebo (open squares) or resveratrol (closed circles). Comparison of the percentage of neutrophils and monocytes performing oxidative burst (C,E) and the intensity of oxidative burst (MFI; (D,F)) following stimulation with E. coli or PMA, respectively. There were no significant differences in phagocytosis or oxidative burst between treatment groups over time (mean ± SD). E. coli, Escherichia coli; MFI, mean fluorescent intensity; PMA, phorbol myristate acetate.

