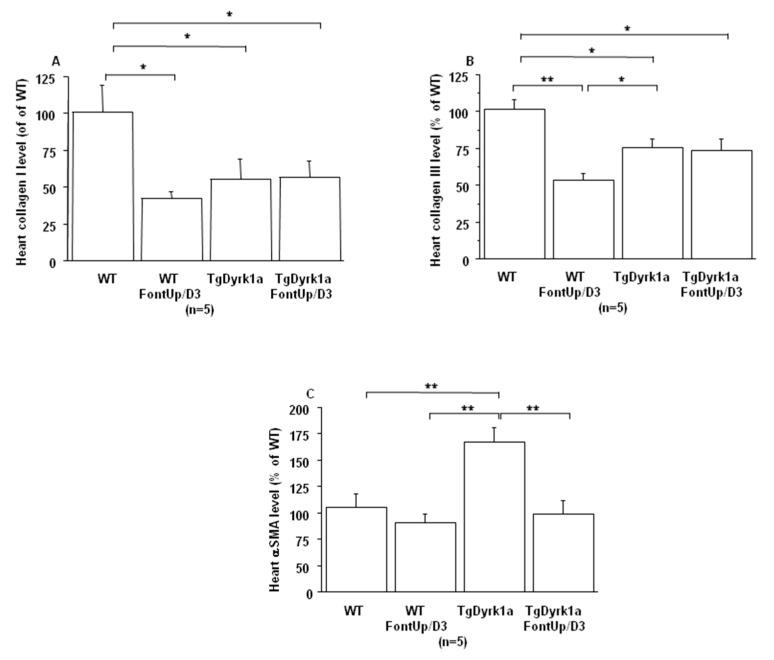
Figure 5.
Comparison of relative heart collagen I (A), collagen III (B) and αSMA (C) protein levels based on slot blot analysis obtained from WT and mice overexpressing Dyrk1A (TgDyrk1A) after oral gavage of D3 FontUp® during eight days (FontUp/D3). Values were obtained by normalization of images from collagen I, collagen III or αSMA to total proteins marked with Ponceau-S. The values are mean ± SEM of n (number of mice) mice normalized to the mean of WT mice without FontUp®. Statistical analysis was done as mentioned in data analysis. * p < 0.05; ** p < 0.005.

