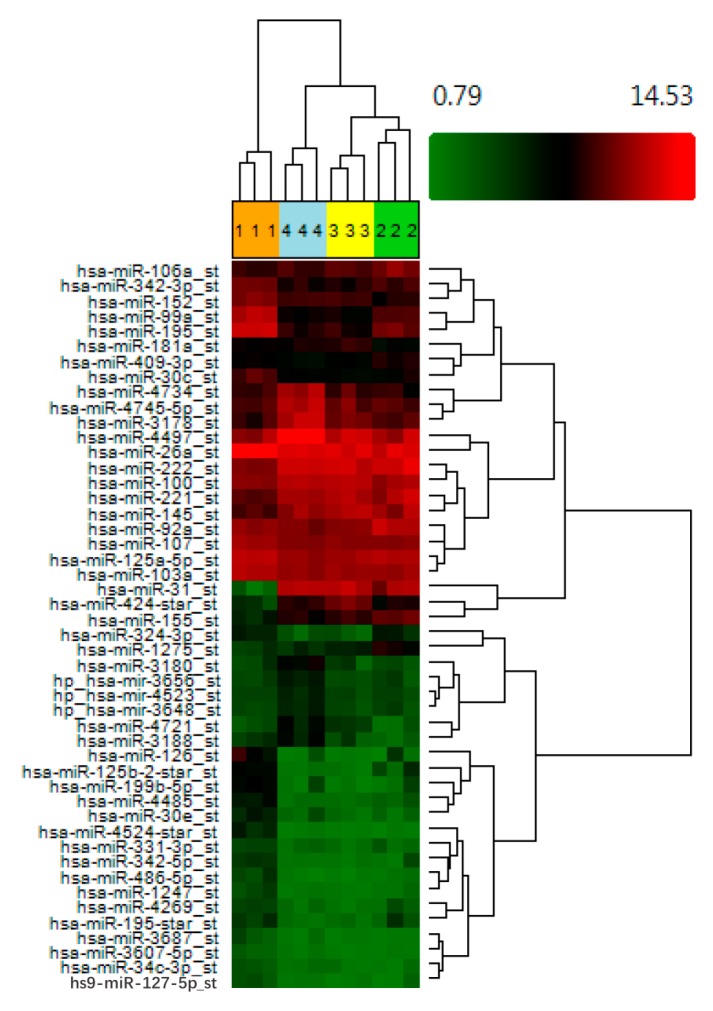
Figure 1.
Compared to ex vivo ASC, cultured ASC exhibit a more similar microRNA expression profile regardless of the time spent in standard tissue culture conditions. MACS-derived ASC from three different donors were subjected to standard tissue culture conditions and microarray analysis was performed at day 0 (group 1 shown in orange), day 3 (group 2 shown in green), day 28 (group 3 shown in yellow), and day 63 (group 4 shown in blue) post sort. A heatmap and dendogram was generated using Transcription Analysis Console™ software (Affymetrix) and a list of all transcripts which exhibited a fold change > 2 (across all four conditions, with an ANOVA p value < 0.005). Green represents downregulated genes and red up regulateded genes from three donor samples.

