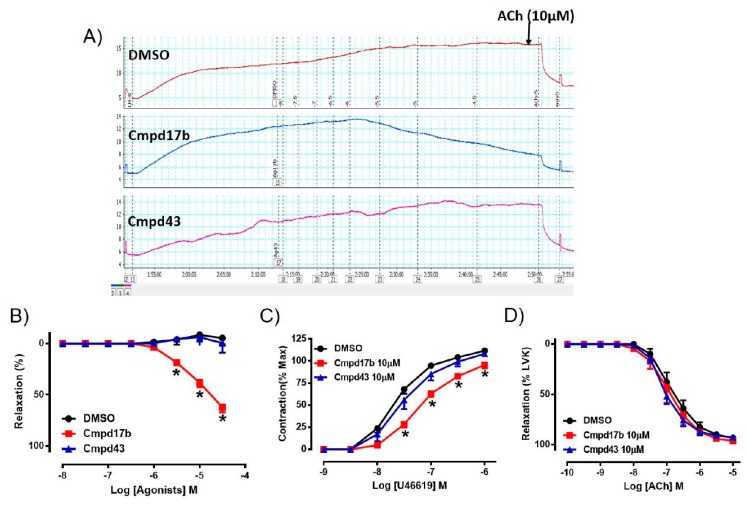
Figure 2.
A representative tracing of (A) vascular reactivity in the abdominal aorta of male mice during a dose response curve to control (DMSO), Cmpd17b, and Cmpd43, prior to exposure to ACh. Concentration–response curves to (B) control, Cmpd17b, and Cmpd43 in the aorta of male mice. Concentration–response curves to (C) U46619 and (D) ACh from male aorta incubated with DMSO (control), Cmpd17b, or Cmpd43. Values are expressed as mean ± SEM, n = 5 per group. Sensitivity (pEC50), maximum relaxation (Rmax), and maximum constriction (Emax) values are shown in Supplementary Table S3. * P < 0.05, significantly different to vehicle control.

