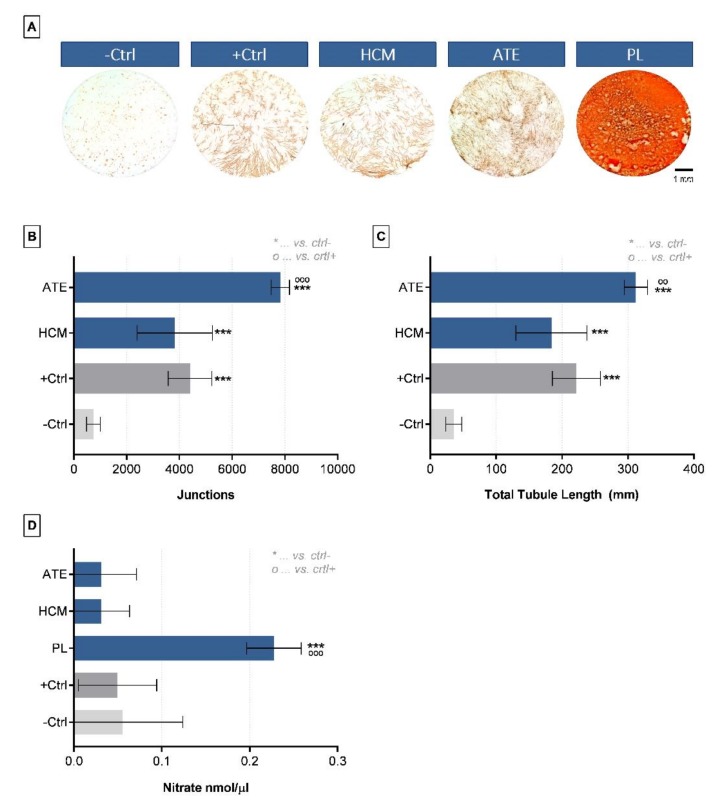
Figure 4.
Angiogenic potential of growth factor mixtures as analyzed by a co-culture of osteogenically induced BM-MSCs and HUVECs. (A) Light microscopic images of tubular structures (visualized by CD31 immunostaining) after 10 days of cultivation in co-culture medium with different growth factor mixtures, (B) number of junctions, (C) total tubule length and (D) nitrate concentration (mean ± SD, n = 3; °° p < 0.01, ***/°°° p < 0.001). -Ctrl: only co-culture medium, +Ctrl: co-culture medium + 20 ng/mL VEGF.

