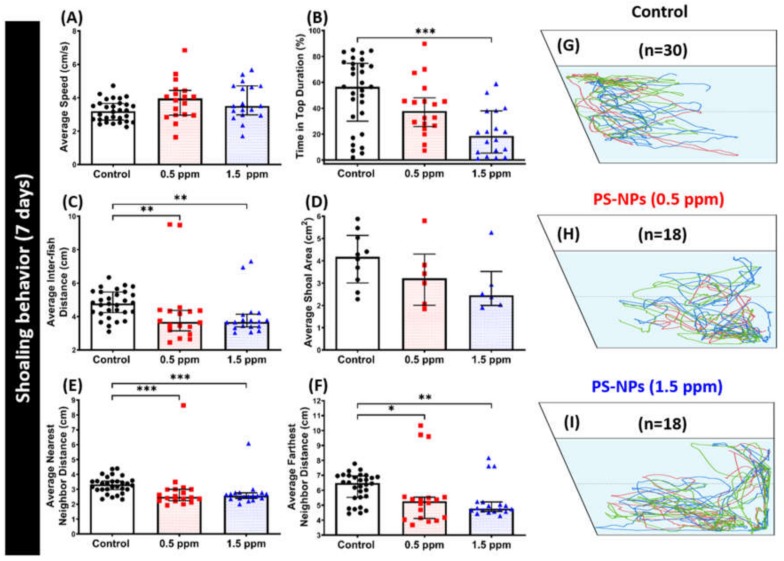
Figure 6.
Shoaling behavior endpoint comparisons between the control and polystyrene nanoplastics (PS-NPs)-exposed zebrafish groups after a ~7-day exposure. (A) Average speed, (B) time in top duration, (C) average inter-fish distance, (D) average shoal area, (E) average nearest neighbor distance, and (F) average farthest neighbor distance, were analyzed. Groups of three fish were tested for shoaling behavior. The 1 min. locomotion trajectories for the control, 0.5 and 1.5 ppm PS-NPs exposed fish in shoaling tests were presented in G, H, I, respectively. The data are expressed as the median with interquartile range were analyzed by a Kruskal–Wallis test, which continued with Dunn’s multiple comparisons test as a follow-up test (n = 30 for control; n = 18 for PS-NP-exposed fish; * p < 0.05, ** p < 0.01, *** p < 0.005).

