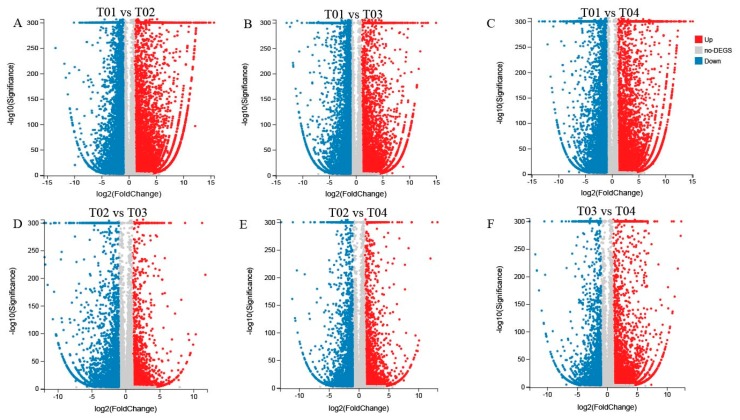
Figure 5.
Volcano plots of the transcriptome between T01 and T02 (A), T01 and T03 (B), T01 and T04 (C), T02 and T03 (D), T02 and T04 (E), and T03 and T04 (F). The statistical significance (log10 of p-value; Y-axis) was plotted against log2-fold change (X-axis). The center of the volcano represents a fold change of zero, while the sides indicate downregulation (negative values) and upregulation (positive values).

