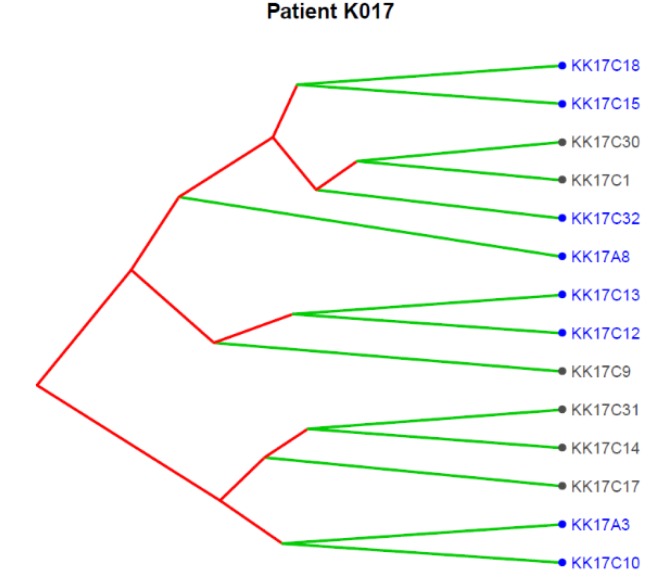
Figure 4.
Translational oncology (TRONCO) was used to order 14 single CTCs isolated from patient K017 into a clonal hierarchy. The figure represents phylogenies of single CTCs grouped into three distinct clones by considering genomic regions altered in at least 50% of all CTCs. Loss at 9p21.3 (indicated by blue color) was observed across all the three clones.

