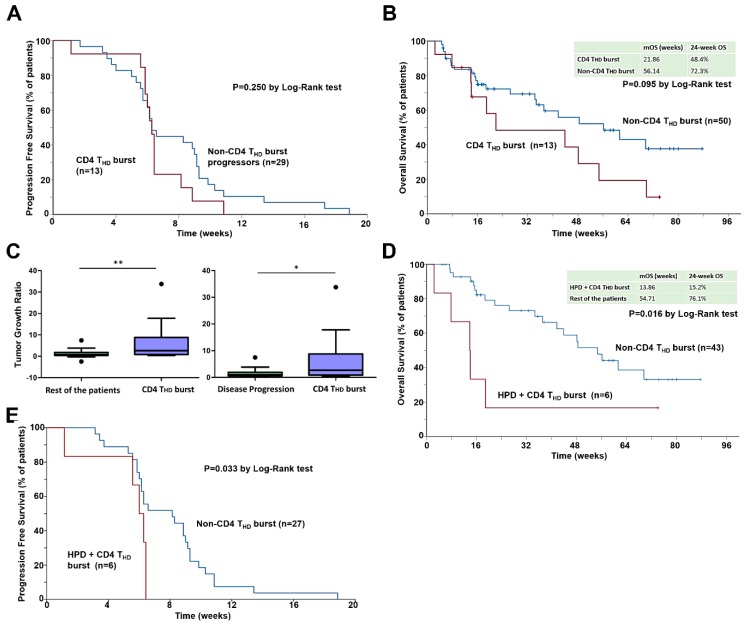
Figure 4.
The CD4 THD burst is associated with HPD, and complements radiological criteria for its diagnosis. (A) Kaplan-Meier plot for PFS only representing patients with processed lymphocyte subpopulations quantified before and after the first cycle of immunotherapy who did not respond to immunotherapy, stratified by the incidence of CD4 THD burst (≥1.3). (B) Kaplan-Meier plot for OS in patients with lymphocyte subpopulations quantified before and after the first cycle of immunotherapy, stratified by detection of CD4 THD burst (≥1.3). (C) Left graph, box and whiskers plot (Tukey) representing median TGR of patients with CD4 THD burst compared to the rest of patients. Box depicts interquartile range, whiskers add up 1.5 interquartile range. Outliers are represented by dots. Right graph, same as left but comparing median TGR of patients with CD4 THD burst compared to the patients that presented progressive disease as best response. (D) Kaplan-Meier plot for OS in patients with measurable disease by RECIST 1.1 and lymphocyte subpopulations quantified before and after the first cycle of immunotherapy, stratified by the presence of both HPD by TGR and the detection of CD4 THD burst (≥1.3). (E) Kaplan-Meier plot for PFS representing patients with measurable disease by RECIST 1.1 and lymphocyte subpopulations quantified before and after the first cycle of immunotherapy, who presented progressive disease as best response, stratified by the presence of both HPD by TGR and the detection of CD4 THD burst (≥1.3). *, **, indicate significant (p < 0.05) and very significant (p < 0.01) statistical differences.

