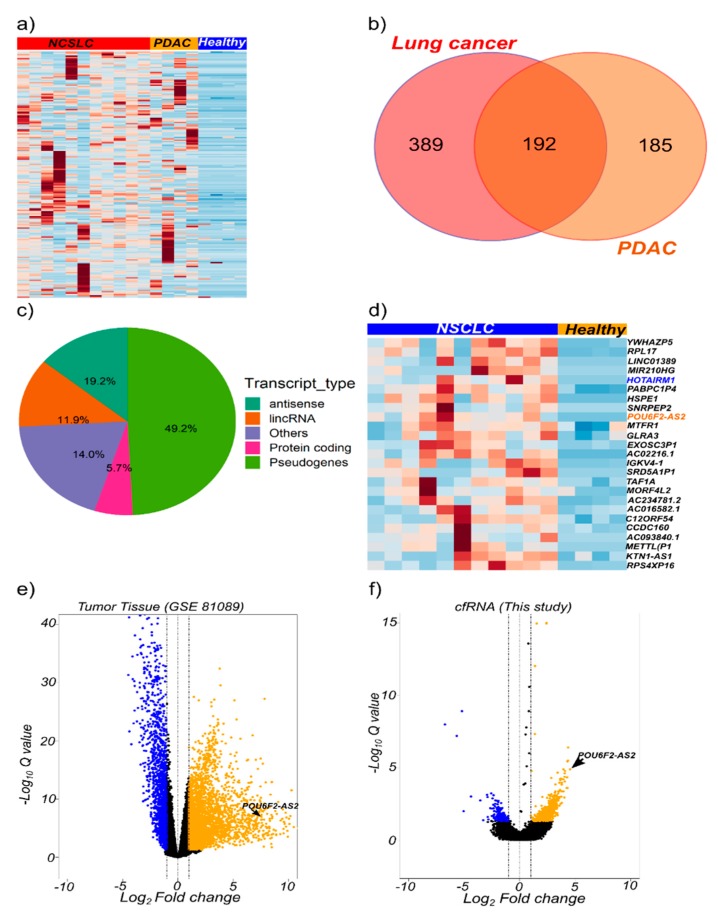
Figure 2.
Total cfRNA transcriptome profiling identify potential cancer biomarkers. (a) Heatmap of genes upregulated in non-small cell lung cancer (NSCLC; n = 11 stage IV patients), and pancreatic ductal adenocarcinoma (PDAC; n = 4 stage IV patients) compared with healthy (n = 4 blood donors) plasma samples. Heatmap is plotted based on 192 common genes. (b) Venn diagram of the number of common upregulated genes in NSCLC and PDAC. (c) Pie chart showing the distribution of transcript types across the common upregulated genes. (d) Heatmap showing upregulated genes in NSCLC (n = 11) and healthy (n = 4) plasma samples based on the expression profiles of 24 genes differentially expressed in cfRNA and tumor-derived RNA. Candidate genes were derived from analyses of tumor/healthy tissue (GSE 81089 dataset) and RNA-Seq data from this study. (e) Volcano plots for differentially expressed genes in GSE 81089 dataset and (f) this study. Genes that passed the log2 fold change ≥ 1 and FDR < 0.05 criteria are highlighted in blue (down-regulation) or yellow (up-regulation).

