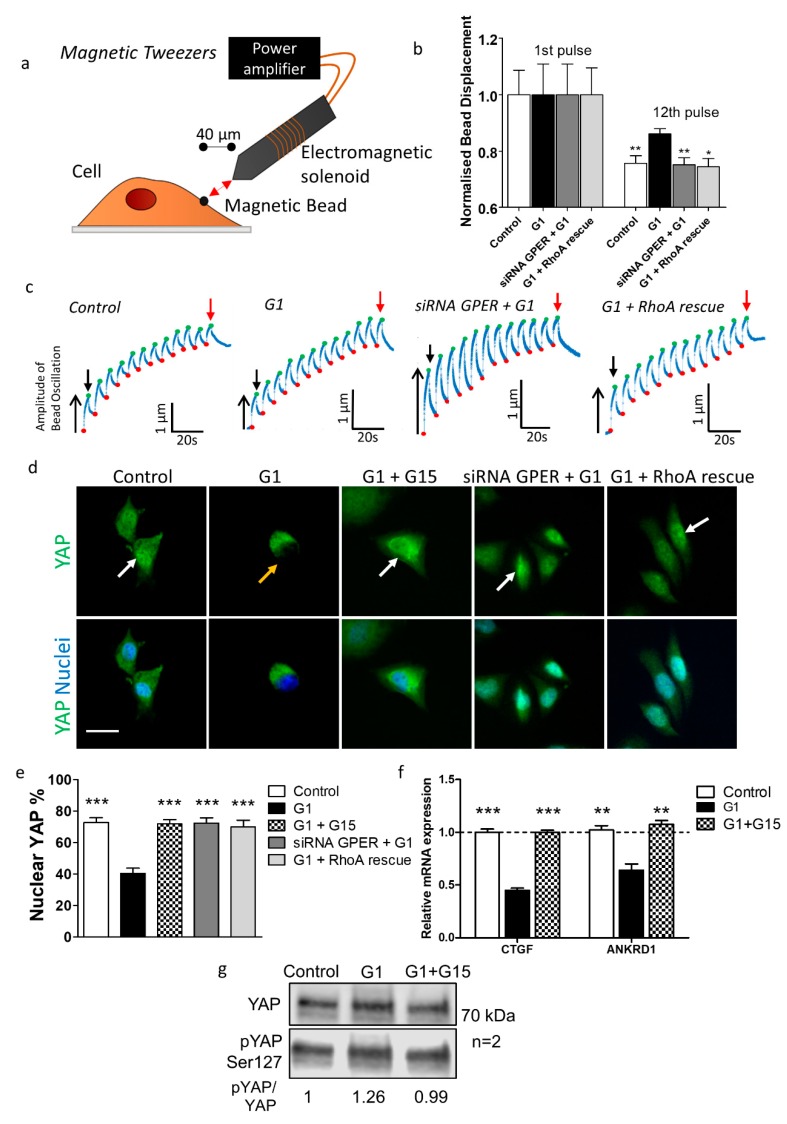
Figure 2.
Mechanosensing in Suit2-007 cells is inhibited by GPER activation. (a) Diagram of magnetic tweezers setup with fibronectin-coated magnetic beads attached to cells, and tweezers placed at 40 µm lateral distance from bead. (b) Relative bead displacement for 1st and 12th pulses for bead profiles where displacement values for 12th pulse < 1st pulse, indicating mechanotransduction. For 1st pulse, error bars = s.e.m. for normalised displacement of bead during 1st pulse of pulsatile regime. For 12th pulse, error bars = s.e.m. for normalised bead displacement values relative to their respective 1st pulse (i.e., values between 0 and 1). For both 1st and 12th pulse, for control, G1, siRNA GPER + G1, and G1 + RhoA (Ras homolog family member A) rescue, n = 25, 16, 28 and 30 cells respectively. Mann–Whitney test comparing each 12th pulse mean to G1 12th pulse mean, * p < 0.05, ** p < 0.01. (c) Representative traces for bead displacement and reinforcement for control, G1, siRNA GPER + G1, and G1 + RhoA rescue conditions. Green points represent the maximum displacement in a pulse and red points the starting displacement in a pulse, which increase due to bead drift. Black downwards arrow indicates 1st pulse and red arrow indicates 12th pulse. (d) Immunofluorescence images of YAP (yes-associated protein 1) nuclear localisation in Suit2-007 under control, G1 (1 µM, 24 h), and G1 + G15 (1 µM and 2 µM respectively, 24 h) conditions. Green represents YAP, and blue represents DAPI staining of the nucleus. White arrow indicates nuclear localisation of YAP, orange arrow indicates cytoplasmic localisation of YAP. Scale bar = 25 µm. (e) Quantification of percentage cells containing nuclear YAP. For control, G1, G1 + G15, siRNA GPER + G1 and G1 + RhoA rescue, n = 24, 24, 20, 12, 12 regions of interest from three independent samples respectively. *** represents Mann–Whitney test between each individual condition and G1 condition, p < 0.001. (f) Quantitative PCR analysis of the YAP-target genes CTGF and ANKRD1, normalised to expression of RPLP0. Dotted line represents y = 1.0. For Mann–Whitney test between each condition and G1 condition, ** p < 0.01, *** p < 0.001. n = three independent samples. (g) Western Blot analysis of YAP and pYAP (phosphorylated on Ser127) for control, G1 and G1 + G15 conditions. n = two independent samples. All experiments with siRNA and RhoA were conducted 72 h after transfection. For experiments with G1, cells were treated with 1 µM G1 for 24 h before analysis. For experiments with G15, cells were treated with 2 µM G15 for 24 h before analysis.

