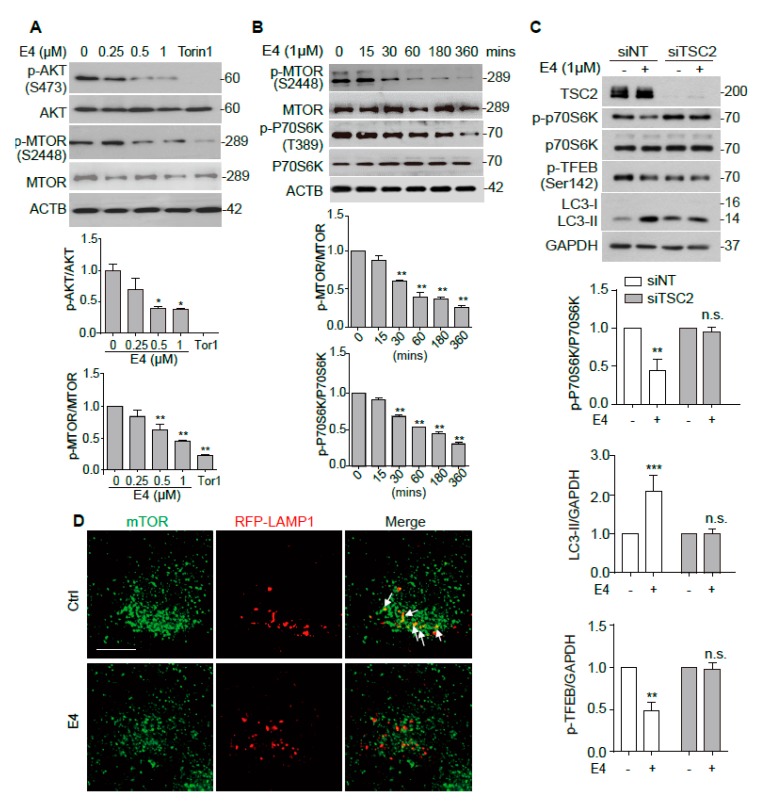
Figure 4.
Compound E4 activates TFEB via inhibiting AKT-MTORC1 pathway. (A) N2a cells were treated with E4 at indicated concentration and positive control Torin1 (250 nM) for 6 h. Representative blots show the expression of phosphorylated (p-) and total AKT and mTOR. Data are presented as the mean ± SEM from three independent experiments. (B) N2a cells treated with 1 μM E4 for different durations (0–6 h). The expression of phosphorylated (p-) and total mTOR and p70S6K were examined by Western blotting. Data are presented as the mean ± SEM from three independent experiments. (C) CF-7 cells were transfected with nontarget siRNA (si-NT, 25 nM), TSC2 siRNA (si-TSC2, 25 nM) for 48 h and treated with E4 (1 μM) for 24 h. Representative blots show the expression of TSC2, phosphorylated (p-) and total mTOR, p-TFEB (Ser142) and LC3 proteins. The relative intensity of p-p70S6K is normalized to that of p70S6K. Relative intensity of p-TFEB and LC3-II is normalized to that of DAPDH. (D) N2a cells were transfected with mTOR and RFP-LAMP1 plasmids for 48 h and then treated with E4 (1 μM) for 24 h. The cells were stained with anti-mTOR antibody. Fluorescence was captured by fluorescence microscopy and representative images are shown. Scale bar: 25 μm. * p < 0.05, ** p < 0.01.

