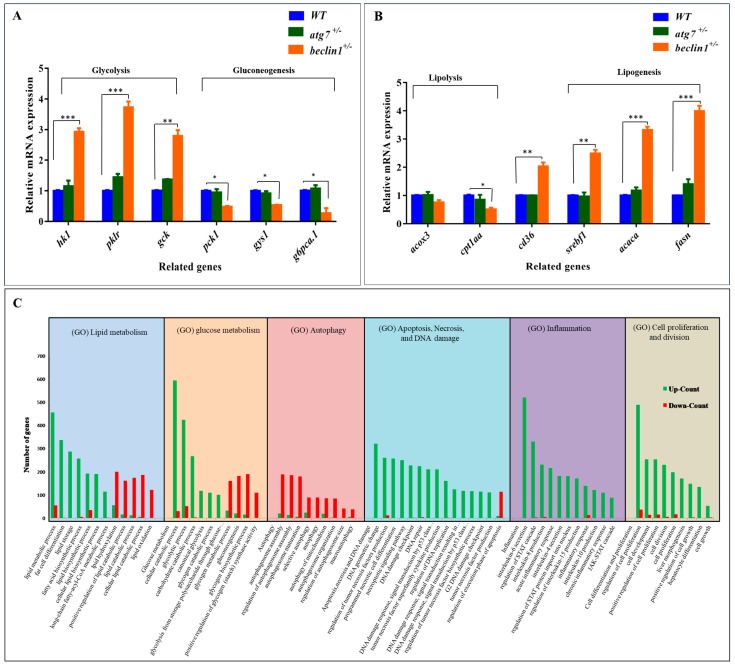
Figure 4.
Effects of beclin1 heterozygosity on the hepatic glucose/lipid flux at the genetic level. Expressions of mRNA in 16-month-old zebrafish evaluated by qRT-PCR for glycolysis and gluconeogenesis related genes (A) and lipolysis and lipogenesis related genes (B) indicating the disturbance of glycogen and lipid metabolism. (C) Gene Ontology (GO) analysis of differential expression genes (DEGs) in the liver between beclin1+/− and WT. The y-axis represents the number of genes of the biological processes in the x-axis. The numbers of upregulated DEGs (green bars) and downregulated DEGs (red bars) are shown. Data are expressed as mean ± SD. * p < 0.05, ** p < 0.01, and *** p < 0.001.

