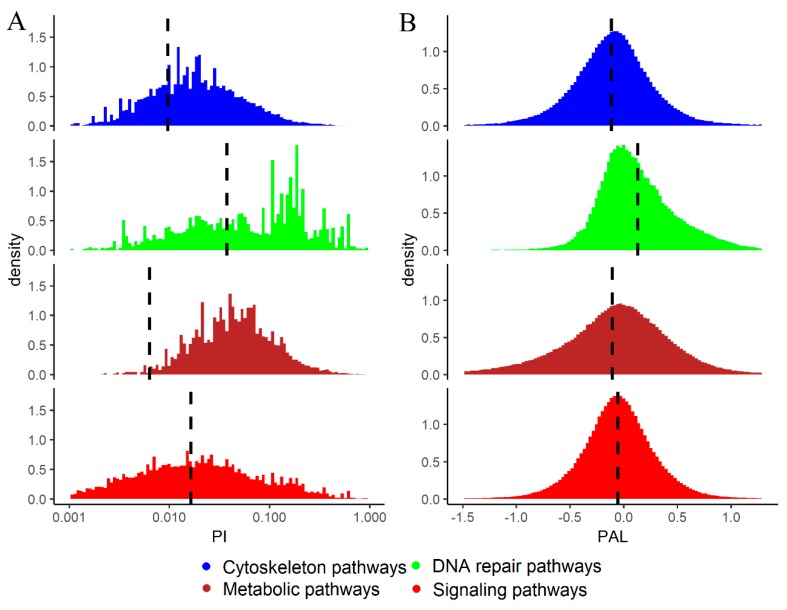
Figure 5.
(A) Distributions of PI > 0 scores for cytoskeleton, metabolic, DNA repair and signaling molecular pathways in 4910 cancer samples. PI axis is given in logarithmic scale. Vertical dashed lines show mean PI values calculated for all cases including PI = 0. (B) Distributions of PAL scores for cytoskeleton, metabolic, DNA repair and signaling molecular pathways in the same cancer samples. Vertical dashed lines show mean PAL values calculated for the respective group of pathways for all tumor samples.

