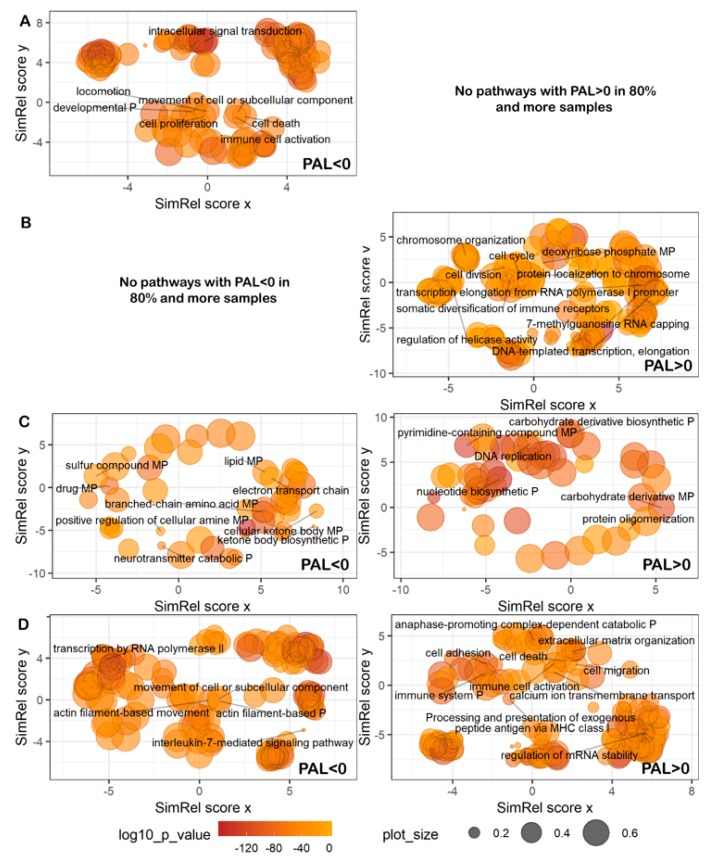
Figure 9.
Representation of Gene Ontology annotations for genes from most strongly downregulated (PAL < 0; left) and upregulated (PAL > 0; right) (A) cytoskeleton, (B) DNA repair, (C) metabolic, (D) signaling pathways. Bubble size indicates the frequency of the Gene Ontology term in the underlying GOA database [54] (bubbles corresponding to more general terms are shown larger). “P” stands for process, “MP”—for metabolic process. Too general and non-informative gene ontology terms are not defined. No cytoskeleton pathways with PAL < 0 and DNA repair pathways with PAL > 0 could be identified in 80% and more samples.

