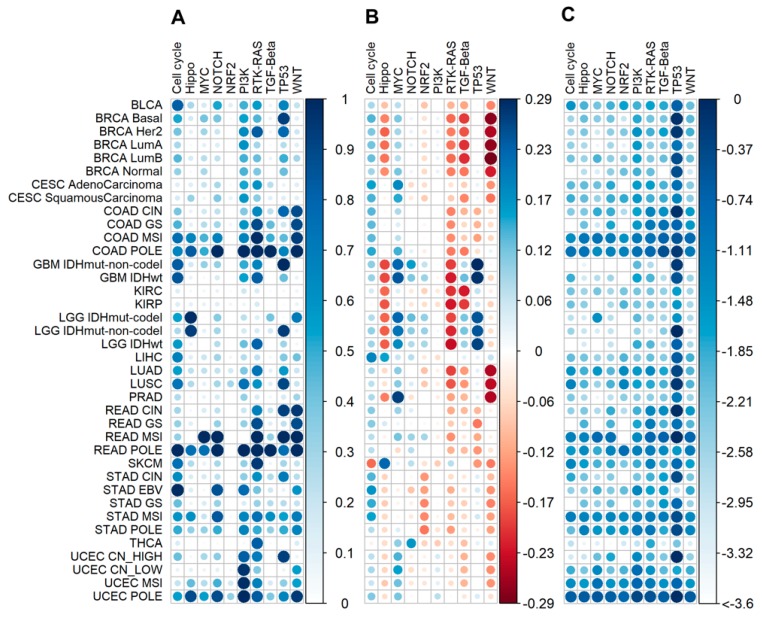
Figure 13.
Comparison of pathway functional metrics for 4382 tumor samples common for this and previous study [22] calculated for ten signaling pathways from [22]. (A) Average BAS (on pathway level) per tumor subtype. (B) Average PAL per tumor subtype. (C) Average lg(PI) per tumor subtype. Molecular tumor subtypes were referred according to [22]: BLCA—Urothelial bladder cancer; BRCA—Breast cancer; CESC—Cervical cancer; KICH—Chromophobe renal cell carcinoma; KIRC—Clear cell kidney carcinoma; COAD—Colon adenocarcinoma; READ—Rectal adenocarcinoma; SKCM—Cutaneous melanoma; GBM—Glioblastoma multiforme; LIHC—Liver hepatocellular carcinoma; LGG—Lower Grade Glioma; LUAD—Lung adenocarcinoma; LUSC—Lung squamous cell carcinoma; KIRP—Papillary kidney carcinoma; PRAD—Prostate adenocarcinoma; STAD—Stomach adenocarcinoma; THCA—Papillary thyroid carcinoma; UCEC—Uterine corpus endometrial carcinoma; CIN—Chromosomal Instability; CN_HIGH—copy-number high; CN_LOW—copy-number low; EBV—Epstein-Barr Virus; GS—Genomically Stable; Her2—Her2-enriched; IDHwt—IDH1-wild-type; IDH mutant-codel—IDH mutant with codeletion of chromosome arm 1p and 19q; IDH mutant-non-codel—IDH mutant with euploid 1p/19q; LumA—Luminal A; LumB—Luminal B; MSI—Microsatellite Instability; POLE—polymerase ε mutant subtype.

