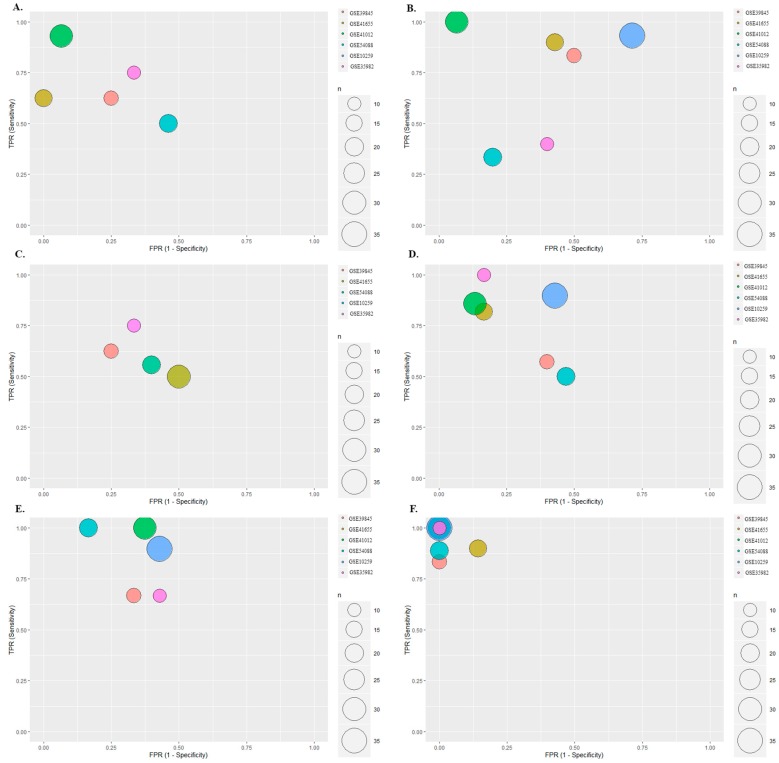
Figure 3.
Meta-analyses results for the predicted miRNA biomarkers. Each circle represents specific GSE datasets included in the meta-analysis, and indicates the sensitivity (y-axis) and 1-specificity (x-axis). The closer to the left corner indicating both sensitivity and specificity close to 1 and the better accuracy of the biomarker for CRC diagnosis). Different sizes and colors of the circles reflect the number of CRC patients for the relevant dataset. (A). miRNA-186-5p: miRNA-186-5p played the best role for the diagnosis of patients in GSE41012 and worst in GSE54088; (B). miRNA-30e-5p: miRNA-30e-5p showed the highest diagnosis value in the diagnosis of GSE41012 CRC patients; (C). miRNA-10b-5p: the patients from GSE35982 and GSE39845 were diagnosed more accurately than the patients in other datasets; (D). miRNA-21-5p: miRNA-21-5p performed a diagnostic value in the CRC patients in GSE35982, GSE41012 and GSE41655; (E). miRNA-31-5p: miRNA-31-5p as an ideal diagnosis biomarker in the CRC patients from GSE54088; (F). Multiple biomarkers showed the best diagnosis value in the CRC patients from all the datasets.

