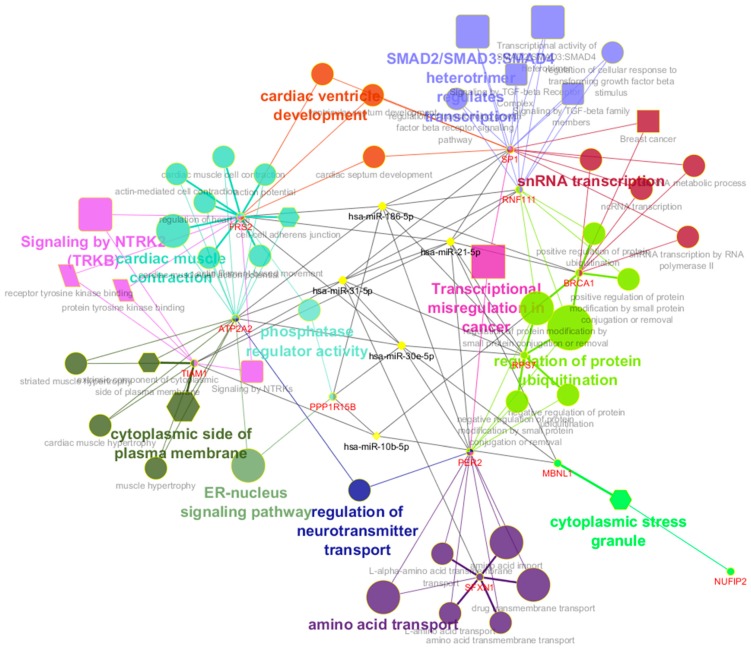
Figure 5.
Biological functions of miRNA-186-5p, miRNA-30e-5p and miRNA-10b-5p, miRNA-21-5p and miRNA-31-5p. The different shapes of nodes represent corresponding pathway sources: Ellipse for Gene ontology (GO) in Biological Process, Hexagon for GO in Cellular Component, Octagon for GO in Immune System Process, Parallelogram for GO in Molecular Function, Rectangle for Kyoto Encyclopedia of Genes and Genomes (KEGG) pathways, Round rectangle for Reactoms pathways. The size of pathway nodes represents the significance of enrichment analysis. We set the miRNAs as yellow nodes. The layout and color of other nodes were automatically assigned by Cytoscape.

